
Figure 7.
- ID
- ZDB-FIG-231124-22
- Publication
- Celotto et al., 2023 - Single-cell RNA sequencing unravels the transcriptional network underlying zebrafish retina regeneration
- Other Figures
-
- Figure 1—figure supplement 1.
- Figure 1—figure supplement 1.
- Figure 1—figure supplement 2.
- Figure 1—figure supplement 3.
- Figure 2—figure supplement 1.
- Figure 2—figure supplement 1.
- Figure 2—figure supplement 2.
- Figure 3—figure supplement 1.
- Figure 3—figure supplement 1.
- Figure 3—figure supplement 2.
- Figure 4.
- Figure 5.
- Figure 6.
- Figure 7.
- Figure 8—figure supplement 1.
- Figure 8—figure supplement 1.
- Figure 8—figure supplement 2.
- Figure 9—figure supplement 1.
- Figure 9—figure supplement 1.
- Figure 10.
- All Figure Page
- Back to All Figure Page
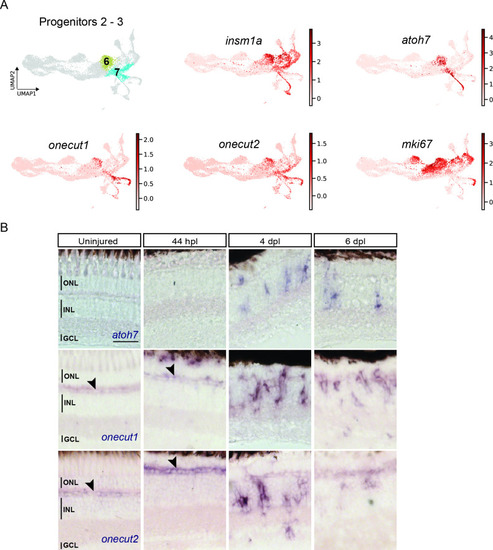
scRNAseq identifies two neurogenic progenitor populations in the light-lesioned retina. ( |