Image
Figure Caption

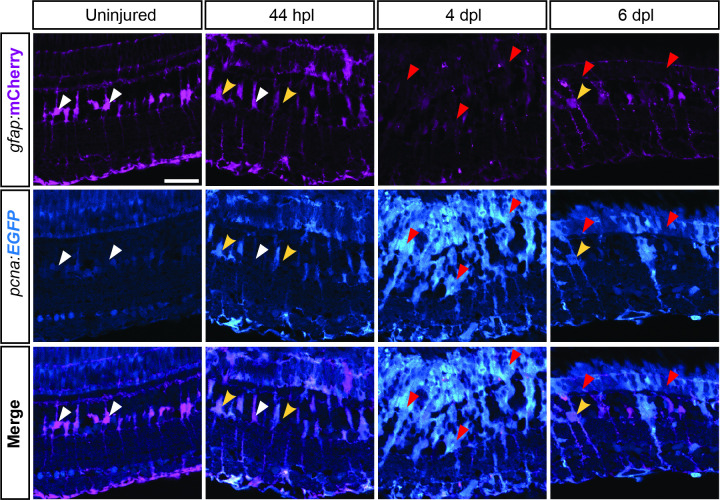
Figure 1—figure supplement 2. expression profile of Tg(pcna:EGFP);Tg(gfap:mCherry) during retina regeneration.

Apotome images showing endogenous immunofluorescence of EGFP and mCherry driven by Tg(pcna:EGFP) and Tg(gfap:mCherry) on retinal sections in uninjured as well as lesioned conditions at different time points. White arrowheads indicate mCherry-positive, EGFP-negative MG. Yellow arrowheads indicate mCherry-/EGFP-double positive MG. Red arrowheads indicate low-mCherry-/EGFP-double positive, putative RPCs. N=3 fish per time point and uninjured controls. Scale bar: 30 µm.

Acknowledgments
This image is the copyrighted work of the attributed author or publisher, and ZFIN has permission only to display this image to its users. Additional permissions should be obtained from the applicable author or publisher of the image. Full text @ Elife