
Image
|
Figure Caption
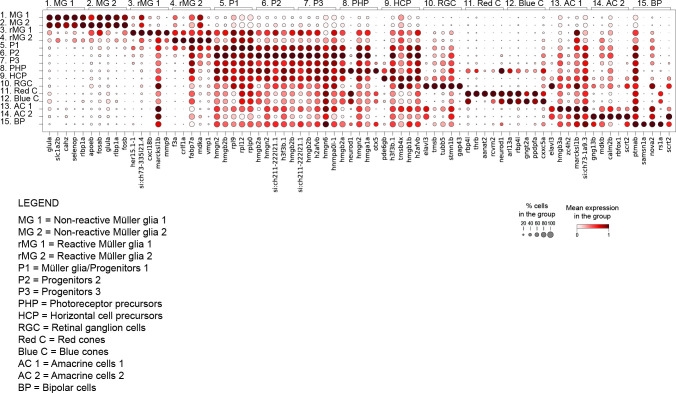
Figure 2—figure supplement 2. Dot plot of top 5 marker genes per cluster.
Dot plot depicting the expression of top 5 marker genes per cluster (see
Acknowledgments
This image is the copyrighted work of the attributed author or publisher, and
ZFIN has permission only to display this image to its users.
Additional permissions should be obtained from the applicable author or publisher of the image.
Full text @ Elife