
- Title
-
The organization of the zebrafish pallium from a hodological perspective
- Authors
- Yáñez, J., Folgueira, M., Lamas, I., Anadón, R.
- Source
- Full text @ J. Comp. Neurol.
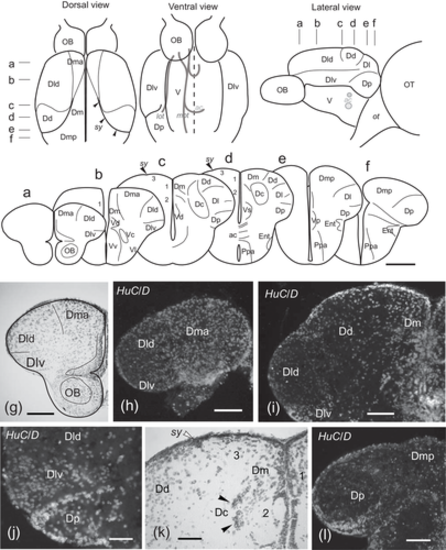
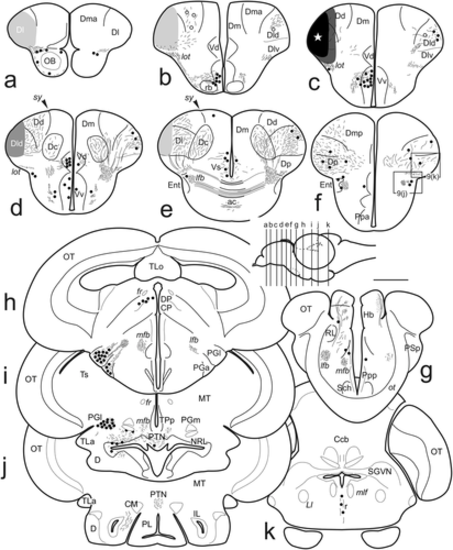
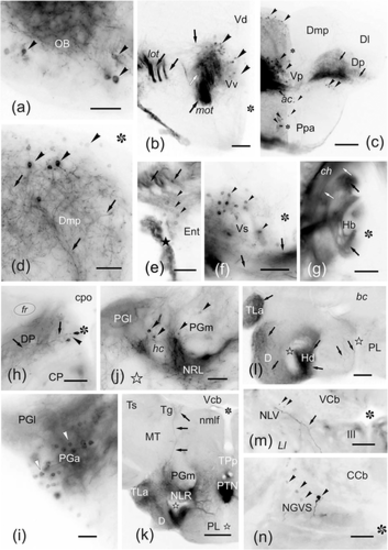
Upper panel, schematic drawings of dorsal, ventral, and lateral views of the adult zebrafish telencephalon showing the external distribution of the main pallial areas considered in this study and the location of internal tracts observed thanks to certain transparency of the tissue (gray lines). Middle panel (a–f), schemes of transverse sections of the telencephalon showing the location of the different pallial and subpallial regions considered in this study. The levels of sections are indicated with dashes in the upper panel. Lower panel (g–l), selected photomicrographs of Nissl staining and HuC/D immunocytochemistry of transverse sections of the zebrafish telencephalon at rostral (g, h) precommissural (i, j), commissural (k), and postcommissural (k) levels showing cytoarchitectonical features of the telencephalic areas used in this study. For abbreviations, see the list. Scale bars: 200 μm (a–f, h–i, l) and 100 μm (g, j–k)
|
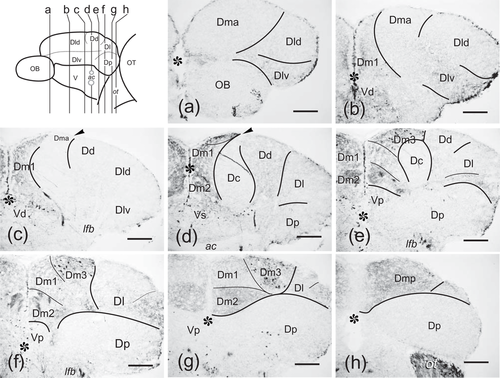
(a–h) Photomicrographs of transverse sections through the zebrafish pallium at precommissural (a–c), commissural (d), and postcommissural (e–h) levels, showing calretinin immunoreactivity. Note differences in fiber density and presence of immunoreactive cells that were used to outline zones and subregions. Asterisks: midline telencephalic ventricle. Arrowheads: sulcus ypsiloniformis. For abbreviations, see the list. Scale bars: 100 μm
|
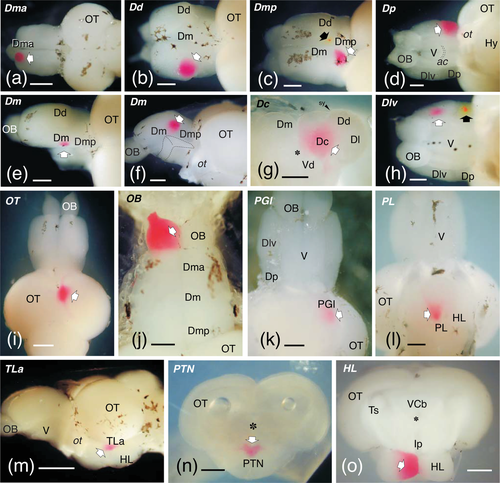
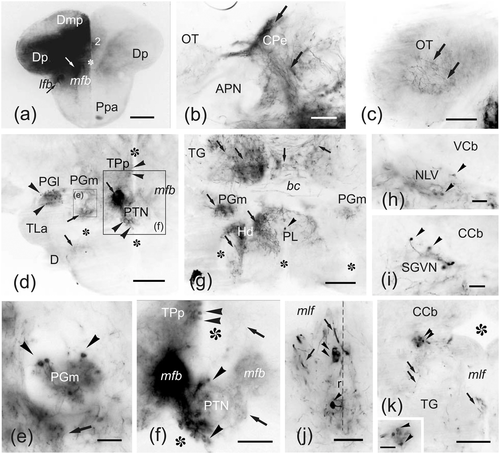
Photographs of brains showing examples of the areas labeled with DiI (outlined arrows) and DiO (black arrows) in various types of experiments. Most applications were done in toto. (a)–(c), and (j) are dorsal views. (d), (h), (k), and (l) are ventral views and (m) is a lateral view. (e) and (f) are dorsal and medial views of the same brain in which the left hemisphere was removed. Examples also include applications to transverse-sectioned en-block brains (g, n, o). In (a–f), (h), and (m), rostral is to the left; in (i–l), rostral is to the top. In (g), (n), and (o), dorsal is to the top. Scale bars: 500 μm (a, i, m); 250 μm (b–h, j–l, n–o)
|
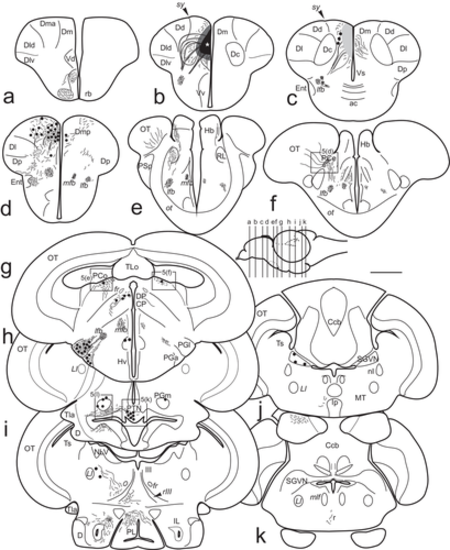
(a–k) Schematic drawings of transverse sections of the zebrafish brain showing structures labeled after application of DiI to the medial zone of the pallium, including Dm1 and 2. Sections are arranged from rostral to caudal and the section levels are indicated in the figurine of the lateral view of the brain. Black circles: retrogradely labeled cells. Small dots and lines: labeled fibers. Shaded areas in (b–c) represent the diffusion area of the tracer from the application point (white star). Scale bar for sections: 500 μm
|
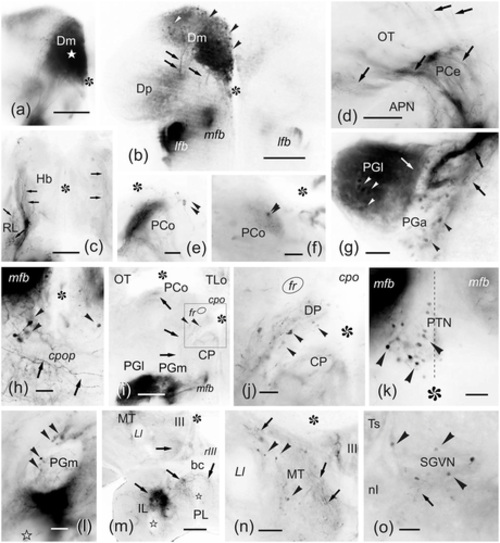
(a–o) Photomicrographs of transverse sections of the zebrafish brain showing labeled structures after application of DiI to the medial zone of the pallium (Dm1-2). The correspondence with the levels of Figure 4 is indicated. (a) Section close to the application point (white star) (see Figure 4b). (b) General view of the posterior telencephalic lobe showing numerous labeled cells in caudal Dm (see Figure 4d). (c) Detail of the habenular region showing labeled varicose fibers in the ipsilateral rostrolateral nucleus and in a lateral plexus in both habenulae (see Figure 4e). (d) Labeled varicose fibers coursing through the ipsilateral central pretectal nucleus (see Figure 4d) and entering the optic tectum. (e–f) Detail of labeled cell bodies and fibers in the ipsi- (e) and contralateral (f) paracommissural pretectal nucleus (see Figure 4g). (g) Section through the anterior and lateral preglomerular nuclei, showing numerous labeled cells and fibers (see Figure 4g). (h) Detail of a small group of retrogradely labeled cell bodies close to the medial forebrain bundle and dorsal to the postoptic commissure. (i–j) General view (i) and detail (j) of the ipsilateral dorsal posterior thalamic nucleus showing a few cell bodies and fibers labeled. Note also the dense neuronal labeling in the medial and lateral preglomerular nuclei. (k) Detail showing retrogradely labeled cell bodies in the ipsilateral side of the posterior tuberal nucleus (the broken line indicates the midline) (see Figure 4h). (l) Detail showing a few cell bodies and fibers labeled in the medial preglomerular nucleus (see Figure 4h). (m) Panoramic view showing numerous labeled fibers in the ventral mesencephalic tegmentum around the third nerve root, and in the hypothalamic inferior and posterior lobes (see Figure 4i). (n) Detail of labeled cell bodies and fibers between the lateral lemniscus and the oculomotor nucleus in the medial mesencephalic tegmentum. (o) Retrogradely labeled cell bodies in the rostral part of the secondary gustatory-visceral nucleus (see Figure 4j). Arrowheads point to cell bodies. Arrows point to fibers and fiber tracts. For abbreviations, see the list. Asterisk: ventricle. Outlined star: recesses of the inferior lobes. Medial is to the right. All photomicrographs are negative images of fluorescent data. Scale bars: 200 μm (a–b, i, m); 100 μm (c–d, n); 50 μm (e–h, j–l, o)
|
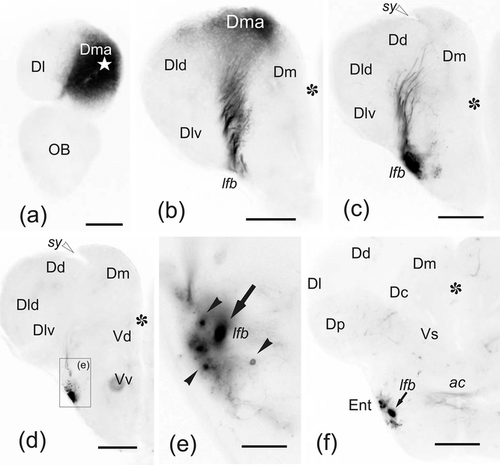
(a–f) Photomicrographs of transverse sections through the telencephalic lobes of zebrafish, from rostral to caudal, showing labeled cell bodies (black arrowheads) and fibers (arrows) after application of DiI to the rostralmost medial zone of the pallium (Dma). (a) Labeling of Dma around the accessed region (white star). (b–c) Sections of more caudal regions showing scant Dma connections with adjacent pallial regions (b), and small fiber bundles coursing toward the (lfb) through deeper pallial regions. (d–f) A terminal field labeled in the entopeduncular nucleus. In (e), note afferent neurons to Dma (arrowheads). Asterisk: telencephalic ventricle. Midline is to the right. Ipsilateral side is to the left. (e) is a detail of the squared area in (d). For abbreviations, see the list. All photomicrographs are negative images of fluorescent data. White arrowheads: sulcus ypsiloniformis. Scale bars: 200 μm (a–d, f); 50 μm (e)
|
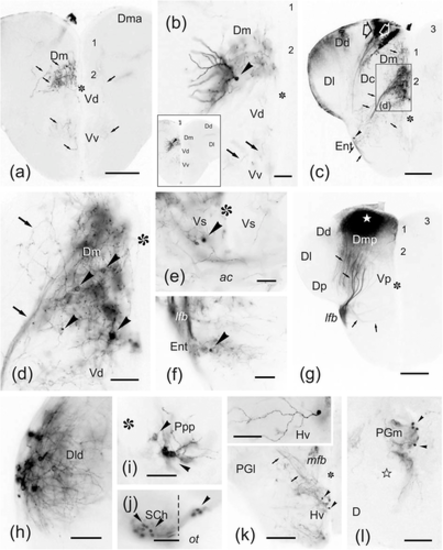
(a–l) Photomicrographs of transverse sections through the brains of two zebrafish showing labeled cells (arrowheads) and fibers (arrows) after application of DiI to the caudal dorsomedial zone of the pallium (Dmp/Dm3). (a–g) Panoramic views (a, c, g) and details (b, d, e, f) of transverse sections through the telencephalic lobe in an experiment with application of a very small DiI crystal to the area marked with a white star (in g). Note that labeled pallial neurons and fibers in levels away the area of application are mostly restricted to ipsilateral Dm2 (a–d), and a few cells in the subpallium: Vs (e) and entopeduncular nucleus (f). In (c), a few ependymal cells and processes were also labeled (outlined arrows). In (g), too, labeled small fiber bundles extend between Dm and the lateral forebrain bundle through the central region of the pallium. Photographs are ordered from rostral to caudal: (a–d) precommissural, (e–f) commissural, and (g) postcommissural levels. Numbers 1–3 indicate Dm subdivisions. (h–l) Sections of a brain where the area of application of DiI to caudal Dm was more extended showing some ipsilateral neurons labeled in Dld (h), the posterior periventricular preoptic nucleus (i), suprachiasmatic nucleus (j), ventral hypothalamus (k), and medial preglomerular nucleus (l). Ipsilateral side is to the left and the midline is indicated by broken lines or defined by the ventricle (asterisk). Outlined star: lateral recess. For abbreviations, see the list. All photomicrographs are negative images of fluorescent data. Scale bars: 200 μm (a, c, g, k); 100 μm (b, e–f–j, l); 50 μm (d, h–i)
|
(a–k) Schematic drawings of transverse sections of the zebrafish brain showing the distribution of cells and fibers labeled after application of DiI to the lateral zone of the pallium (Dl). The level of sections from rostral to caudal is indicated in a lateral view of the brain. Black circles, retrogradely labeled cells. Small dots and lines, labeled fibers and tracts. Shaded areas in (a–e) represent the areas with dense labeling by the tracer from the point of application of the small DiI crystal (white star in c). Ipsilateral is at the left. Scale bar for sections: 500 μm
|
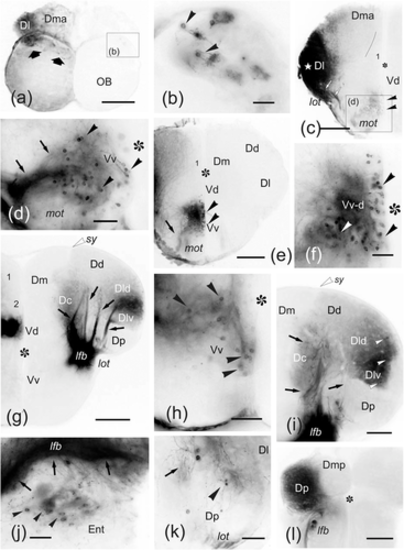
(a–l) Photomicrographs of transverse sections through the telencephalic lobes of zebrafish, from rostral to caudal, showing the labeling of cell bodies (arrowheads) and fibers (arrows) after application of DiI to precommissural (Dl). Ipsilateral is to the left. (a) Sections through the olfactory bulb showing labeling in dorsal glomeruli (arrows). (b) Detail of labeled bodies (arrowheads) and glomerular dendrites of mitral cell in the dorsolateral glomerular field of the contralateral olfactory bulb. (c) Section of ipsilateral telencephalic lobe at retrobulbar level showing the extension of dense labeling around the application area (star), labeled fibers in the lateral olfactory tract (arrows) and retrogradely labeled cell bodies (arrowheads) in the subpallium. (d) Detail of the labeled cell bodies in the retrobulbar region dorsal to the medial olfactory tract. (e–f) Panoramic view (e) and detail (f) showing numerous retrogradely labeled cell bodies (arrowheads) in the ipsilateral dorsal Vv (Vv-d). (g) Panoramic view of the contralateral telencephalic lobe at a precommissural level showing pallial projections to Dl from the lateral forebrain bundle (lfb). Note also a compact group of labeled cells in the ipsilateral Vd. (h) Detail of labeled cells in the ipsilateral Vv. (i) Detail of the contralateral pallium at commissural level showing labeled cell bodies (arrowheads) and areas with labeled fibers (in Dl and Dc). Note the clear limit of labeling of Dlv with Dp. (j) Photomicrograph showing labeled fibers in the contralateral lateral forebrain bundle (arrows) and some labeled cell bodies close the dorsal entopeduncular nucleus (arrowheads) at commissural level. (k) Detail of a labeled cell at the contralateral Dl at postcommissural level. (l) Section through of the caudal telencephalon showing labeling in the ipsilateral posterior pallium. Asterisk: telencephalic ventricle. Numbers indicate Dm subregions. For abbreviations, see the list. All photomicrographs are negative images of fluorescent data. Scale bars: 200 μm (a, c, e, g, l); 100 μm (d, i, k); 50 μm (b, f, h, j)
|
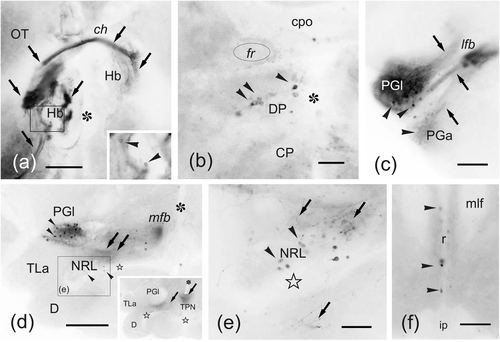
(a–f) Photomicrographs of transverse sections through the zebrafish brain showing labeling in extratelencephalic regions after application of DiI to precommissural Dl. Arrowheads: cell bodies. Arrows: fibers and tracts. (a) Transverse section through the epithalamus showing occasional labeled cells (inset) and fibers crossing through the habenular commissure to reach the contralateral habenula. (b) Section showing labeled cells in the dorsal posterior nucleus of the thalamus. (c–e) Photomicrographs and details of sections of the hypothalamus-posterior tubercle, showing labeled cells and fibers from the ipsilateral Dl in the lateral preglomerular nucleus (c–d) and nucleus of the lateral recess (e). (f) Section of the isthmus showing labeled cells in the superior raphe dorsally to the interpeduncular nucleus. Arrowheads point to labeled cells, arrows to fibers. Asterisk: third ventricle (a, b) and hypothalamic lateral recess (d–e). Outlined stars: inferior and posterior lobe recesses. For abbreviations, see the list. All photomicrographs are negative images of fluorescent data. Scale bars: 200 μm (d); 100 μm (a, c, f); 50 μm (b, e)
|
(a–j) Photomicrographs of transverse sections of zebrafish brain showing intra- (a–g) and extratelencephalic (h–j) structures labeled in an experiment of application of DiI to Dd (open arrow in c–e). Correspondences with schemes of Figure 11 are indicated. Black arrowheads: cell bodies. Arrowheads: fibers and fiber bundles. (a–g) Sections through rostral (a–b), precommissural (c), commissural (d–f), and postcommissural (g) telencephalic levels, showing ipsilateral (at left) and contralateral (at right) labeling of pallial areas well delimited mainly in Dd, Dld, Dc, and Dma, and also in the subpallial Vd. Dm and Dp are mostly free of labeling. In €, note a detail of Vd showing retrogradely labeled cells (black arrowheads). (h–j) Sections through the ipsilateral hypothalamus showing dense labeling of the lateral preglomerular nucleus (h) and bundles of labeled fibers (black arrows) coursing from the lateral forebrain bundle (see g) and reaching caudally the hypothalamic posterior lobe (j), as well as occasional labeled cells (black arrowheads) dorsal to the PGm, Hv, and periventricular TPp (i) (correspondence of (h–j) with levels depicted in Figure 11i–j is partial). Numbers 1–3 indicate Dm subdivisions. Asterisks: ventricle. Stars: inferior lobe recess. All photomicrographs are negative images of fluorescent data. For abbreviations, see the list. Scale bars: 200 μm (b–d, g); 100 μm (a, f, h–j); 50 μm (e)
|
(a–j) Schematic drawings of transverse sections of the zebrafish brain showing structures labeled after application of DiI to the posterior zone of the pallium (Dp) using a ventrolateral approach. The level of sections is indicated in the lateral view of the brain. Black circles, retrogradely labeled cells. Small dots and lines, labeled fibers. Shaded areas in (c–e) represent the diffusion area of the tracer from the application point (white star in e). Scale bar for sections: 500 μm
|
(a–n) Photomicrographs of transverse sections of the zebrafish brain showing intra- (a–f) and extratelencephalic (g–n) labeled cells (arrowheads) and fibers (arrows) after application of DiI to ventral Dp. (a) Section through the ipsilateral olfactory bulb showing mitral cell perikarya and numerous labeled afferent fibers in the granular layer. (b) Detail of the precommissural subpallium showing numerous labeled neurons in dorsal Vv as well as fibers in the medial and lateral olfactory tracts. (c) Panoramic view at the level of the application point showing bilateral labeling in Dp and ipsilateral Dmp. (d) Detail of labeled cells and fibers in the ipsilateral Dmp. (e) Detail of labeled cells in the ipsilateral entopenduncular nucleus. Black star, meningeal tissue. (f) Detail of labeled neurons in Vs. (g) Detail of the ipsilateral habenula showing labeled fibers in the habenular neuropil (black arrows) and the tracts of the habenular commissure (white arrows). (h) Detail of labeled periventricular cells and fibers in the dorsal posterior thalamic nucleus (DP). (i) Detail of labeled cells in the ipsilateral anterior preglomerular nucleus. (j) Section through the ipsilateral preglomerular region showing some labeled cells between the lateral and medial preglomerular nuclei, and numerous fibers in the lateral recess nucleus (NLR). (k–l) Sections through rostral (k) and intermediate (l) levels of the hypothalamic inferior lobes showing a number of labeled fibers in the dorsal tegmental nucleus (Tg), the lateral hypothalamus (TLa, D, NLR, Hd), and posterior tuberal nucleus (PTN). (m) Section through the mesencephalic tegmentum showing fibers in the lateral valvular nucleus. (n) Section through the rostral isthmus showing labeled cells in the secondary gustatory/visceral nucleus. Asterisk: ventricle. Outlined stars: inferior lobe recess. For abbreviations, see the list. All photomicrographs are negative images of fluorescent data. Scale bars: 200 μm (c, l, k); 100 μm (b, g, j, m); 50 μm (a, d–f, h–i, n)
|
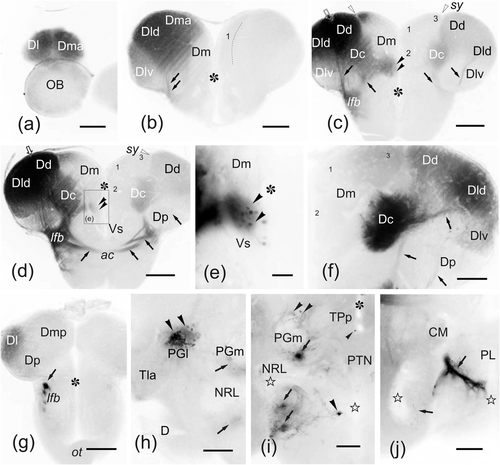
(a–k) Photomicrographs of transverse sections of the zebrafish brain ordered from rostral to caudal showing cells (arrowheads) and fibers (arrows) labeled after application of DiI to Dc in a brain en-block sectioned at commissural level. (a) Panoramic view of a section of the telencephalic lobes caudal to the application point. Note that Dp and Dm2 were heavily labeled, probably en-passant, through the various fibers bundles traversing Dc between major telencephalic tracts and more superficial pallial areas. Ipsilateral is to the left. (b) Section through the ipsilateral pretectum showing dense innervation of the central pretectal nucleus (CPe) by labeled fibers. (c) Section through the rostral optic tectum showing labeled varicose fibers. (d–f) Section through the hypothalamus-posterior tuberal area (d) and details (e–f) showing labeled cells and fibers in the ipsilateral PGl, PGm, and PTN. (g) Sections through the caudal hypothalamus and midbrain tegmentum showing bilateral labeled projections to the PGm, the hypothalamic posterior lobe and the tegmentum, and ipsilateral projection to Hv. (h–j) Details showing labeled cells in the lateral valvular nucleus (h), the secondary gustatory/visceral nucleus (i), and the superior raphe nucleus (j). (k) Section at the level of the trigeminal nerve exit showing a group of labeled cells in the ipsilateral dorsal rhombencephalic tegmentum and fibers in the reticular area. Asterisk, ventricle. For abbreviations, see the list. All photomicrographs are negative images of fluorescent data. Scale bars: 200 μm (a, c–d, g, k); 100 μm (b, f); 50 μm (e, h–j, inset in k)
|
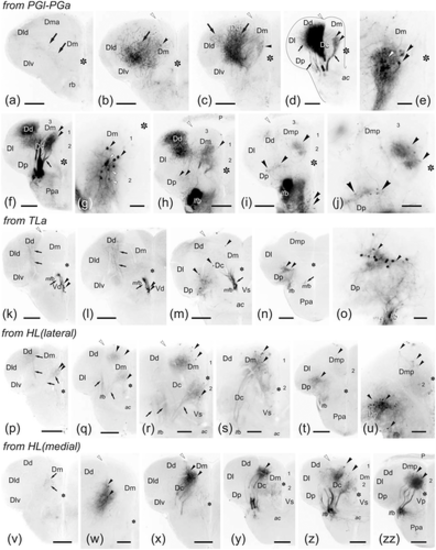
(a–zz) Photomicrographs of transverse sections through the telencephalic lobes showing labeled cells (black arrowheads) and fibers (arrows) after application of DiI to the extratelencephalic areas indicated at top left of each picture group. (a–j,) Labeling from the lateral preglomerular nucleus, (k–o) from the torus lateralis, and (p–u) from the lateral part of the hypothalamic lobes; (v–zz) from the medial part of the hypothalamic lobes. Ipsilateral is to the left. Numbers 1–3 indicate the Dm subdivisions. Open arrowheads point to the sulcus ypsiloniformis. Asterisk, midline ventricle. For abbreviations, see the list. All photomicrographs are negative images of fluorescent data. Scale bars: 200 μm (a–d, f, h–i, k–n, p–q, t, v, x–zz); 100 μm (j, r–s, u, w); 50 μm (e, g, o)
|
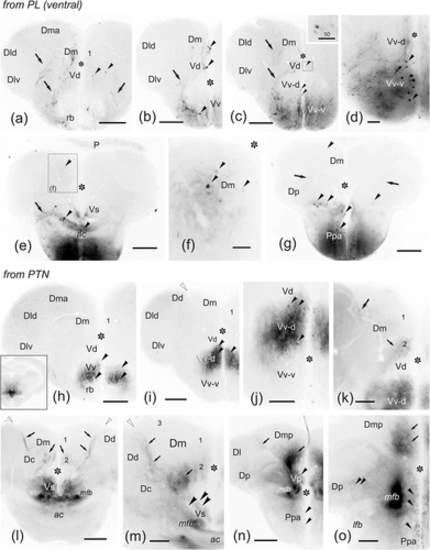
(a–o) Photomicrographs of transverse sections through the telencephalic lobes showing labeled cells (black arrowheads) and fibers (arrows) after application of DiI to the ventral part of the hypothalamic posterior lobe (a–g) and to the posterior tuberal nucleus (PTN) (h–o). Open arrowheads point to the sulcus ypsiloniformis. Numbers 1–3 indicate Dm subdivisions. Asterisk, midline ventricle. For abbreviations, see the list. All photomicrographs are negative images of fluorescent data. Scale bars: 200 μm (a–c, e, g, h–i, l, n); 100 μm (j–k); 50 μm (d, f)
|
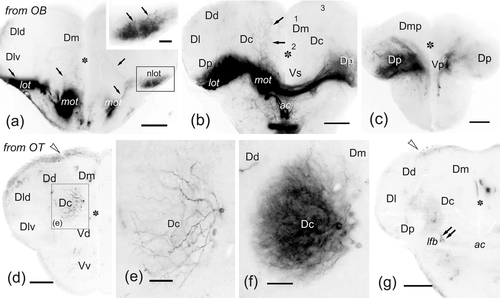
(a–g) Photomicrographs of transverse sections at precommissural (a, d–e) commissural (b, g) and postcommissural (c) levels through telencephalic lobes showing labeled cells (arrowheads) and fibers (arrows) after DiI application to the olfactory bulb (a–c) and rostral optic tectum (d–g). Note the heavy bilateral olfactory projections on the nlot (detailed in a) and Dp in a–c, as well as fibers in Dm at commissural level (b). Note also projections on the lateral region of Vs and Vv (for details of projections, see Gayoso et al., 2011, 2012). (d–g) Note the intense labeling of Dc neurons extending dendritic trees to the central neuropil (d–f) at precommissural levels and sending axons to the optic tectum via the lateral forebrain bundle (g). No labeled cells were observed at commissural telencephalic levels (g). Ipsilateral is to the left. Numbers 1–3 indicate Dm subdivisions. Asterisk, ventricle. For abbreviations, see the list. All photomicrographs are negative images of fluorescent data. Scale bars: 200 μm (a–b, d, g); 100 μm (b); 50 μm (e, inset in a); 25 μm (f) |
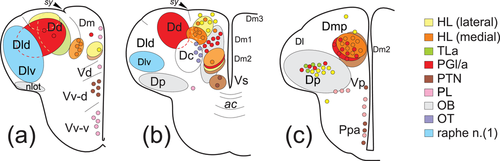
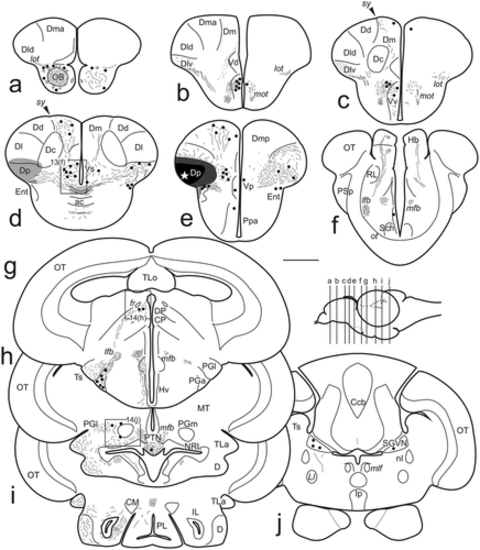
(a–c) Schematic drawings of transverse sections through the zebrafish telencephalon at precommissural (a), commissural (b), and postcommissural (c) levels summarizing the main fields receiving olfactory and caudal extratelencephalic afferents (depicted as colored regions) and pallial and subpallial efferent cells projecting to these regions (color-coded dots). For abbreviations, see the list. (1) Raphe-telencephalic connections are based in Lillesaar et al. (2009) and in present results |