
FIGURE
Fig. 9
- ID
- ZDB-FIG-220809-51
- Publication
- Yáñez et al., 2021 - The organization of the zebrafish pallium from a hodological perspective
- Other Figures
- All Figure Page
- Back to All Figure Page
Fig. 9
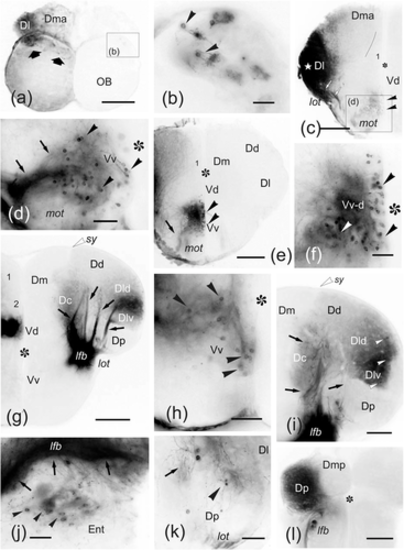
(a–l) Photomicrographs of transverse sections through the telencephalic lobes of zebrafish, from rostral to caudal, showing the labeling of cell bodies (arrowheads) and fibers (arrows) after application of DiI to precommissural (Dl). Ipsilateral is to the left. (a) Sections through the olfactory bulb showing labeling in dorsal glomeruli (arrows). (b) Detail of labeled bodies (arrowheads) and glomerular dendrites of mitral cell in the dorsolateral glomerular field of the contralateral olfactory bulb. (c) Section of ipsilateral telencephalic lobe at retrobulbar level showing the extension of dense labeling around the application area (star), labeled fibers in the lateral olfactory tract (arrows) and retrogradely labeled cell bodies (arrowheads) in the subpallium. (d) Detail of the labeled cell bodies in the retrobulbar region dorsal to the medial olfactory tract. (e–f) Panoramic view (e) and detail (f) showing numerous retrogradely labeled cell bodies (arrowheads) in the ipsilateral dorsal Vv (Vv-d). (g) Panoramic view of the contralateral telencephalic lobe at a precommissural level showing pallial projections to Dl from the lateral forebrain bundle (lfb). Note also a compact group of labeled cells in the ipsilateral Vd. (h) Detail of labeled cells in the ipsilateral Vv. (i) Detail of the contralateral pallium at commissural level showing labeled cell bodies (arrowheads) and areas with labeled fibers (in Dl and Dc). Note the clear limit of labeling of Dlv with Dp. (j) Photomicrograph showing labeled fibers in the contralateral lateral forebrain bundle (arrows) and some labeled cell bodies close the dorsal entopeduncular nucleus (arrowheads) at commissural level. (k) Detail of a labeled cell at the contralateral Dl at postcommissural level. (l) Section through of the caudal telencephalon showing labeling in the ipsilateral posterior pallium. Asterisk: telencephalic ventricle. Numbers indicate Dm subregions. For abbreviations, see the list. All photomicrographs are negative images of fluorescent data. Scale bars: 200 μm (a, c, e, g, l); 100 μm (d, i, k); 50 μm (b, f, h, j)
|
Expression Data
Expression Detail
Antibody Labeling
Phenotype Data
Phenotype Detail
Acknowledgments
This image is the copyrighted work of the attributed author or publisher, and
ZFIN has permission only to display this image to its users.
Additional permissions should be obtained from the applicable author or publisher of the image.
Full text @ J. Comp. Neurol.