
Image
|
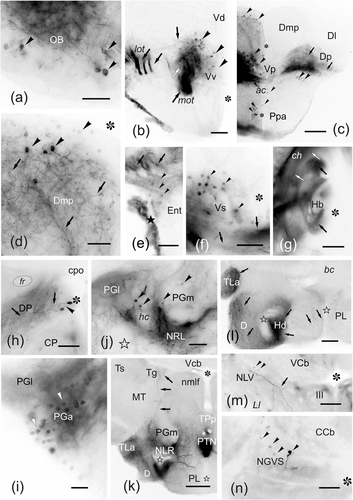
Figure Caption
Fig. 14
(a–n) Photomicrographs of transverse sections of the zebrafish brain showing intra- (a–f) and extratelencephalic (g–n) labeled cells (arrowheads) and fibers (arrows) after application of DiI to ventral Dp. (a) Section through the ipsilateral olfactory bulb showing mitral cell perikarya and numerous labeled afferent fibers in the granular layer. (b) Detail of the precommissural subpallium showing numerous labeled neurons in dorsal Vv as well as fibers in the medial and lateral olfactory tracts. (c) Panoramic view at the level of the application point showing bilateral labeling in Dp and ipsilateral Dmp. (d) Detail of labeled cells and fibers in the ipsilateral Dmp. (e) Detail of labeled cells in the ipsilateral entopenduncular nucleus. Black star, meningeal tissue. (f) Detail of labeled neurons in Vs. (g) Detail of the ipsilateral habenula showing labeled fibers in the habenular neuropil (black arrows) and the tracts of the habenular commissure (white arrows). (h) Detail of labeled periventricular cells and fibers in the dorsal posterior thalamic nucleus (DP). (i) Detail of labeled cells in the ipsilateral anterior preglomerular nucleus. (j) Section through the ipsilateral preglomerular region showing some labeled cells between the lateral and medial preglomerular nuclei, and numerous fibers in the lateral recess nucleus (NLR). (k–l) Sections through rostral (k) and intermediate (l) levels of the hypothalamic inferior lobes showing a number of labeled fibers in the dorsal tegmental nucleus (Tg), the lateral hypothalamus (TLa, D, NLR, Hd), and posterior tuberal nucleus (PTN). (m) Section through the mesencephalic tegmentum showing fibers in the lateral valvular nucleus. (n) Section through the rostral isthmus showing labeled cells in the secondary gustatory/visceral nucleus. Asterisk: ventricle. Outlined stars: inferior lobe recess. For abbreviations, see the list. All photomicrographs are negative images of fluorescent data. Scale bars: 200 μm (c, l, k); 100 μm (b, g, j, m); 50 μm (a, d–f, h–i, n)
Acknowledgments
This image is the copyrighted work of the attributed author or publisher, and
ZFIN has permission only to display this image to its users.
Additional permissions should be obtained from the applicable author or publisher of the image.
Full text @ J. Comp. Neurol.