
Image
|
Figure Caption
Fig. 7
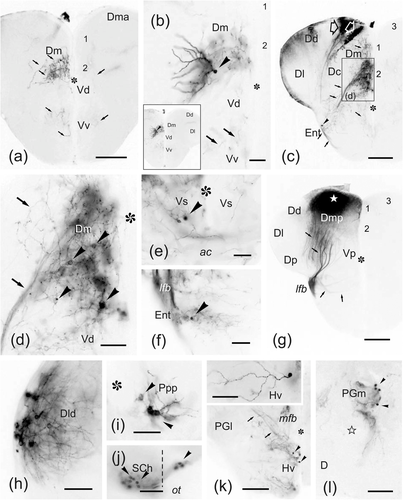
(a–l) Photomicrographs of transverse sections through the brains of two zebrafish showing labeled cells (arrowheads) and fibers (arrows) after application of DiI to the caudal dorsomedial zone of the pallium (Dmp/Dm3). (a–g) Panoramic views (a, c, g) and details (b, d, e, f) of transverse sections through the telencephalic lobe in an experiment with application of a very small DiI crystal to the area marked with a white star (in g). Note that labeled pallial neurons and fibers in levels away the area of application are mostly restricted to ipsilateral Dm2 (a–d), and a few cells in the subpallium: Vs (e) and entopeduncular nucleus (f). In (c), a few ependymal cells and processes were also labeled (outlined arrows). In (g), too, labeled small fiber bundles extend between Dm and the lateral forebrain bundle through the central region of the pallium. Photographs are ordered from rostral to caudal: (a–d) precommissural, (e–f) commissural, and (g) postcommissural levels. Numbers 1–3 indicate Dm subdivisions. (h–l) Sections of a brain where the area of application of DiI to caudal Dm was more extended showing some ipsilateral neurons labeled in Dld (h), the posterior periventricular preoptic nucleus (i), suprachiasmatic nucleus (j), ventral hypothalamus (k), and medial preglomerular nucleus (l). Ipsilateral side is to the left and the midline is indicated by broken lines or defined by the ventricle (asterisk). Outlined star: lateral recess. For abbreviations, see the list. All photomicrographs are negative images of fluorescent data. Scale bars: 200 μm (a, c, g, k); 100 μm (b, e–f–j, l); 50 μm (d, h–i)
Acknowledgments
This image is the copyrighted work of the attributed author or publisher, and
ZFIN has permission only to display this image to its users.
Additional permissions should be obtained from the applicable author or publisher of the image.
Full text @ J. Comp. Neurol.