
Image
|
Figure Caption
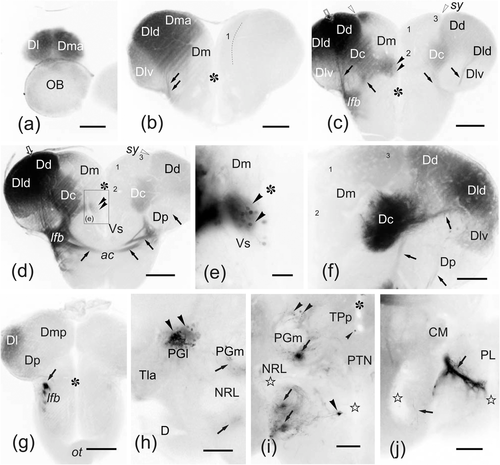
Fig. 12
(a–j) Photomicrographs of transverse sections of zebrafish brain showing intra- (a–g) and extratelencephalic (h–j) structures labeled in an experiment of application of DiI to Dd (open arrow in c–e). Correspondences with schemes of Figure 11 are indicated. Black arrowheads: cell bodies. Arrowheads: fibers and fiber bundles. (a–g) Sections through rostral (a–b), precommissural (c), commissural (d–f), and postcommissural (g) telencephalic levels, showing ipsilateral (at left) and contralateral (at right) labeling of pallial areas well delimited mainly in Dd, Dld, Dc, and Dma, and also in the subpallial Vd. Dm and Dp are mostly free of labeling. In €, note a detail of Vd showing retrogradely labeled cells (black arrowheads). (h–j) Sections through the ipsilateral hypothalamus showing dense labeling of the lateral preglomerular nucleus (h) and bundles of labeled fibers (black arrows) coursing from the lateral forebrain bundle (see g) and reaching caudally the hypothalamic posterior lobe (j), as well as occasional labeled cells (black arrowheads) dorsal to the PGm, Hv, and periventricular TPp (i) (correspondence of (h–j) with levels depicted in Figure 11i–j is partial). Numbers 1–3 indicate Dm subdivisions. Asterisks: ventricle. Stars: inferior lobe recess. All photomicrographs are negative images of fluorescent data. For abbreviations, see the list. Scale bars: 200 μm (b–d, g); 100 μm (a, f, h–j); 50 μm (e)
Acknowledgments
This image is the copyrighted work of the attributed author or publisher, and
ZFIN has permission only to display this image to its users.
Additional permissions should be obtained from the applicable author or publisher of the image.
Full text @ J. Comp. Neurol.