
- Title
-
Elevated 4-hydroxynonenal induces hyperglycaemia via Aldh3a1 loss in zebrafish and associates with diabetes progression in humans
- Authors
- Lou, B., Boger, M., Bennewitz, K., Sticht, C., Kopf, S., Morgenstern, J., Fleming, T., Hell, R., Yuan, Z., Nawroth, P.P., Kroll, J.
- Source
- Full text @ Redox Biol.
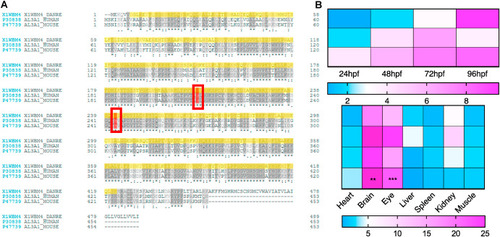
Fig. 1. Sequence alignment of Aldh3a1 across different species and expression of aldh3a1 mRNA in zebrafish. (A). Amino acid alignment showed a high similarity and same active sites (red frame) between different species: First line, zebrafish Aldh3a1; Second line, human ALDH3A1; Third line, mouse ALDH3A1. (B). Heatmap of aldh3a1 mRNA expression in wild type zebrafish showed an increasing trend from 24 hpf to 96 hpf in larvae, and brain and eye were the most expressed adult organs. The higher and lower expression is displayed in pink and blue, respectively. Expression of genes was determined by RT-qPCR and normalized to b2m. The average values of 24 hpf wild type larvae and heart (adult organs) were standardized to 1; Larvae: n = 3 clutches with 30 larvae, adult organs: n = 4 with one organ per sample. For statistical analysis one-way ANOVA followed by Sidak's multiple comparison test was applied, **p < 0.01, ***p < 0.001. RT-qPCR, real-time quantitative polymerase chain reaction; hpf, hours after post fertilization; b2m, β2 microglobulin. (For interpretation of the references to colour in this figure legend, the reader is referred to the Web version of this article.) |
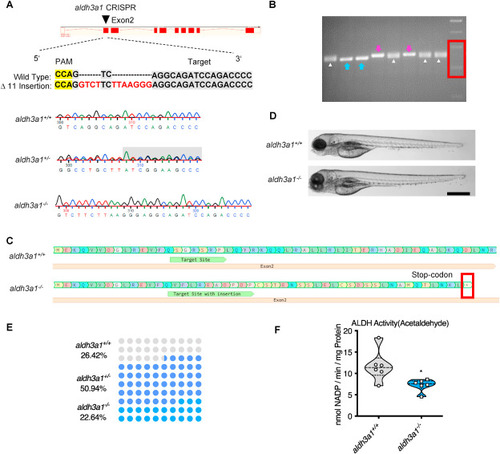
Fig. 2. Generation of Aldh3a1 knockout zebrafish by using CRISPR-Cas9 technology. (A). Aldh3a1-CRISPR-target site was designed in exon2 of aldh3a1 and CRISPR/Cas9-induced insertions of 11 nucleotides was selected for further investigation. Genotype was analysed and chromatogram showed aldh3a1 wild type, heterozygous, and homozygous sequencing results. (B). Genotyping-PCR gel showed the distinguishable bands of aldh3a1 wild type, homozygous and heterozygous zebrafish mutant line. The blue arrows, purple arrows and white deltas indicate the genotyping-PCR products from aldh3a1 wild type, homozygous and heterozygous zebrafish, respectively. The red frame indicates the marker, lower band is 200 bp and upper band is 300 bp. PCR product size: wildtype, 255 bp; homozygous, 266 bp. (C). Amino acid sequence showed a stop-codon in exon2 of aldh3a1−/−. (D). Microscopic images showed normal gross morphology of aldh3a1−/− larvae in comparison with aldh3a1+/+ larvae at 96 hpf. Black scale bar: 500 μm. (E). Adult fish number among different genotypes was in line with the Mendelian Inheritance in the first generation of F2: aldh3a1+/+ = 14, aldh3a1+/− = 27 and aldh3a1−/− = 12. (F). Aldh3a1−/− zebrafish showed decreased enzyme activity (acetaldehyde as substrate) measured by spectrophotometric analysis in zebrafish lysates at 96 hpf; n = 6 clutches with 46–50 larvae. For statistical analysis Student's t-test was applied, *p < 0.05. Bp, base pair. PAM, protospacer-adjacent motif. (For interpretation of the references to colour in this figure legend, the reader is referred to the web version of this article.) |
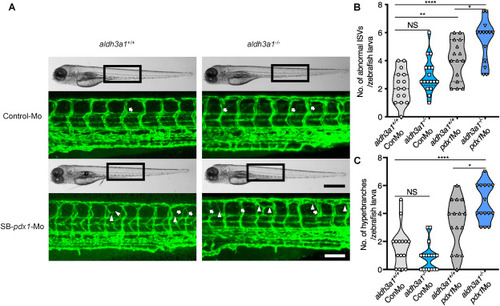
Fig. 3. Trunk vascular alterations were enhanced by endogenous pdx1 expression silencing in aldh3a1−/− Tg(fli1:EGFP) zebrafish larvae. Endogenous pdx1 expression silencing by pdx1 morpholino injection led to enhanced formation of abnormal ISVs and hyperbranches in trunk vasculature of aldh3a1−/− Tg(fli1:EGFP) zebrafish larvae at 96 hpf. (A). Representative light microscopic images showed the gross morphology of zebrafish larvae and black boxes indicate region seen in the confocal images. White arrows indicate the abnormal ISVs and white deltas indicate the hyperbranches. White scale bar = 100 μm, black scale bar = 500 μm. (B–C). Quantification of abnormal ISVs and hyper branches formation in violin plots; n = 15–17 per group. 6 ng of morpholinos: Control-Mo and SB-pdx1-Mo were injected into the one-cell stage of zebrafish embryos respectively. For statistical analysis one-way ANOVA followed by Sidak's multiple comparison test was applied, *p < 0.05, **p < 0.01, ****p < 0.0001. pdx1, pancreatic and duodenal homeobox 1; ISVs, intersegmental vessels; Mo, morpholino; NS, not significant. PHENOTYPE:
|
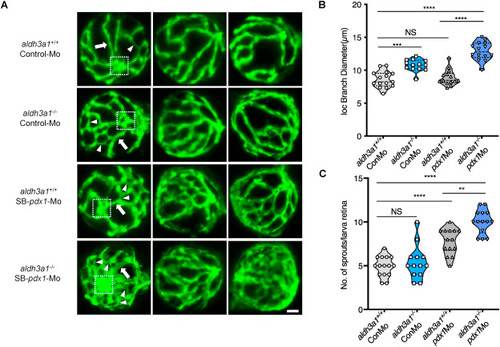
Fig. 4. Retina hyaloid vascular alterations were enhanced by endogenous pdx1 expression silencing in aldh3a1−/− Tg(fli1:EGFP) zebrafish larvae. Endogenous pdx1 expression silencing by pdx1 morpholino injection led to widening IOC branch diameters and increased sprouts formation in hyaloid vasculature of aldh3a1−/− Tg(fli1:EGFP) zebrafish larvae at 120 hpf. (A). Representative confocal scans of the isolated hyaloid vasculature in aldh3a1+/+ and aldh3a1−/− larvae after Control-Mo or SB-pdx1-Mo injection. At 120 hpf, the hyaloid network has a basket-like structure branching off at the central hyaloid/optic artery (white box) and connects to the circumferential inner annular hyaloid vessel (white arrow) encompassing the lens, also regularly called IOC in the matured adult retinal vasculature. Several sprouts (white delta) interconnect the basket-like vascular arcades and indicate the angiogenesis directly. White scale bar = 20 μm. (B–C). Quantification of the IOC branch diameter and sprouts formation in violin plots, n = 13–15 per group. 6 ng of morpholinos: Control-Mo and SB-pdx1-Mo were injected into the one-cell stage of zebrafish embryos, respectively. For statistical analysis one-way ANOVA followed by Sidak's multiple comparison test was applied, **p < 0.01, ***p < 0.001, ****p < 0.0001. Mo, morpholino; IOC, inner optic circle; NS, not significant. PHENOTYPE:
|
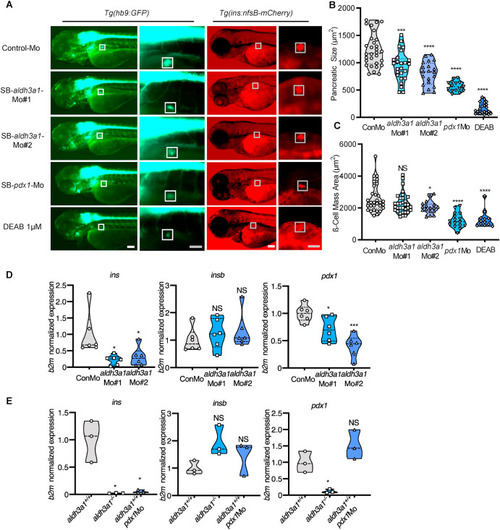
Fig. 5. Primary pancreas was disrupted by ALDH inhibition, aldh3a1 transient silencing and permanent knockout in zebrafish larvae. (A). ALDH inhibition by DEAB treatment, and endogenous aldh3a1 expression silencing induced decreased dimensions of the primary pancreas in Tg(hb9:GFP) and a reduced sign of β cell mass area in Tg(ins:nfsB-mCherry) zebrafish larvae at 72 hpf. White box indicates the primary pancreas; Grey box indicates the β cell mass area; White scale bar = 100 μm, grey scale bar = 50 μm. (B–C). Quantification of area size of the primary pancreas (B) and β cell mass(C) in violin plots, n = 12–33 per group. (D–E). Similar to pdx1 morpholino mediated silencing (E), ins mRNA expression was decreased significantly in both aldh3a1 silencing(D) and Aldh3a1 permanent knockout (E) zebrafish larvae at 48 hpf, while insb was unaltered. Expression of mRNA was analysed by RT-qPCR and was normalized to b2m. The average values of Control-Mo injected (D) and aldh3a1+/+ zebrafish larvae (E) were standardized to 1, n = 3–6 clutches with 30 larvae per group. 6 ng of each morpholino was injected into the one-cell stage of zebrafish embryos, respectively. For statistical analysis one-way ANOVA followed by Sidak's multiple comparison test was applied, *p < 0.05, ***p < 0.001, ****p < 0.0001. Mo, morpholino; NS, not significant; ins, preproinsulin; insb, preproinsulin b; DEAB, N,N-diethylaminobenzaldehyde. EXPRESSION / LABELING:
PHENOTYPE:
|
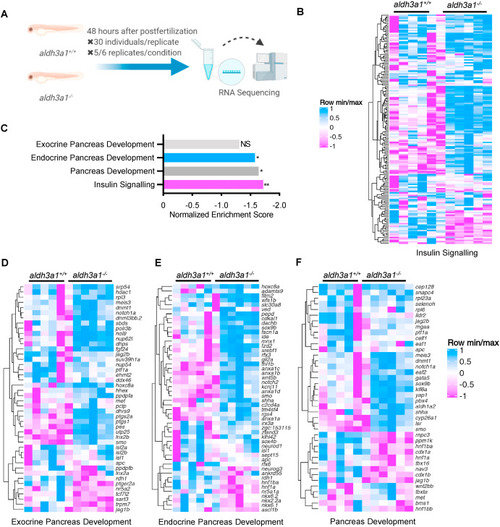
Fig. 6. Down-regulated insulin signalling and endocrine but not exocrine pancreas development pathway in aldh3a1−/− zebrafish larvae. (A). Schematic diagram of larval RNA-Seq. 30 larvae per clutch, 5 clutches of aldh3a1+/+ and 6 clutches of aldh3a1−/− zebrafish larvae at 48 hpf was used for RNA isolation. (B–C). RNA-Seq Heatmap showed relative mRNA expression in insulin signalling pathway (B), which was significantly down-regulated in aldh3a1−/− larvae via KEGG analysis (C), **p = 0.003. (D–F). RNA-Seq Heatmap showed relative mRNA expression in exocrine (D), endocrine (E) and whole (F) pancreas development pathway, and endocrine but not exocrine pancreas development pathway was significantly down-regulated in GSEA analysis(C). The higher and lower expression is displayed in pink and blue, respectively. Adjust p value: *p < 0.05, **p < 0.01; NS, not significant; GSEA, gene set enrichment analysis; KEGG, kyoto encyclopedia of genes and genomes. |
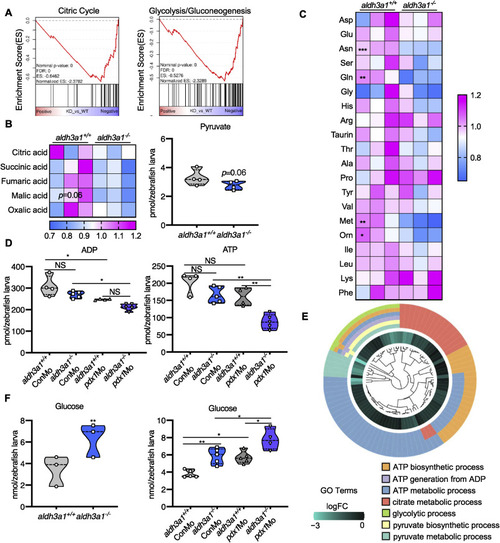
Fig. 7. Aldh3a1 knockout zebrafish larvae exhibited impaired glucose homeostasis and can be further aggravated by endogenous pdx1 expression silencing. (A). RNA-Seq GSEA analysis showed down-regulated expression of Citric Cycle and Glycolysis/Gluconeogenesis at 48 hpf; And (B) the intermediates of Citric Cycle and pyruvate showed a decreased trend at 96 hpf in aldh3a1−/− zebrafish larvae. (C). Amino acid profile displayed several reduced glycogenic amino acids, including Asn, Gln and Met in aldh3a1−/− larvae at 96 hpf. (D) ADP and ATP showed decreased levels in aldh3a1−/− larvae and achieved significantly lowest ATP and ADP levels with pdx1 silencing at 96hpf; (E). All these metabolomic changes were further confirmed via RNA-Seq GO pathway enrichment analysis, and all core genes showed down-regulated logFC value in the involved seven pathways. (F). Increased glucose level was determined in aldh3a1−/− larvae at 48 hpf, while pdx1 silencing enhanced the impaired glucose homeostasis. 6 ng of each morpholino was injected into the one-cell stage of zebrafish embryos respectively. n = 3–6 as each violin plot or heatmap showed. For statistical analysis, paired samples t-tests or one-way ANOVA followed by Sidak's multiple comparison test was applied, *p < 0.05, **p < 0.01, ***p < 0.001. Asn, asparagine; Gln, glycine; Met, methionine. |
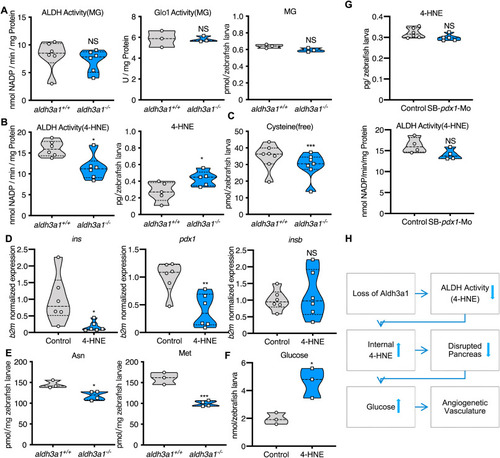
Fig. 8. Defective 4-HNE detoxification and the elevation of 4-HNE induced the imbalance of glucose homeostasis after Aldh3a1 loss. (A). Aldh3a1−/− zebrafish larvae showed unaltered ALDH activity, Glo1 activity when MG as substrate and unchanged MG amount at 96 hpf. (B–C). Aldh3a1−/− zebrafish larvae showed decreased ALDH activity when 4-HNE as substrate, increased 4-HNE amount and decreased free cysteine at 96 hpf, but pdx1 morphants showed no significant change in ALDH activity and 4-HNE amount. (D–F). 10 μM 4-HNE treatment in wild type zebrafish larvae caused: (D). Decreased ins and pdx1 mRNA expression at 48 hpf. Expression of mRNA was analysed by RT-qPCR and was normalized to b2m; (E). Reduced glycogenic amino acids Asn and Met at 96hpf; (F). Elevated glucose at 120 hpf. (G). 4-HNE and ALDH dependent 4-HNE detoxification ability were not changed in zebrafish larvae with pdx1 silencing at 96hpf. (H). Concise mechanism flow chart showed the consequence of defective 4-HNE detoxification after Aldh3a1 loss. n = 3–7 clutches as each plot showed with 30–50 larvae per group. For statistical analysis paired samples t-tests were applied. *p < 0.05, **p < 0.01, ***p < 0.0010.4-HNE, 4-Hydroxynonenal; Glo1, glyoxalase 1; MG, methylglyoxal. |
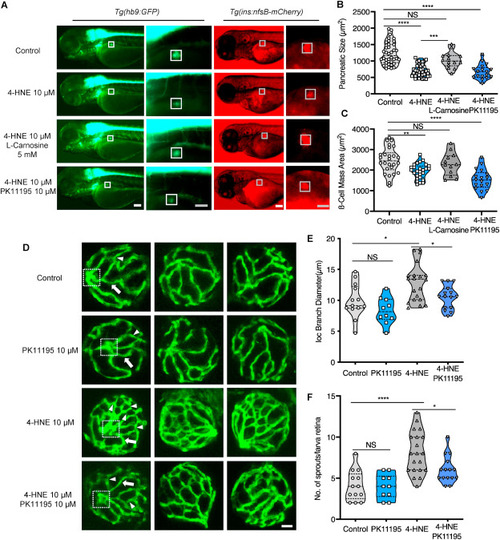
Fig. 9. Exogenous 4-HNE disrupted the pancreas, induced hyaloid vascular alterations, and can be rescued via l-Carnosine and PK11195 treatment, respectively. (A). 10 μM 4-HNE treatment induced decreased dimensions of the primary pancreas in Tg(hb9:GFP) and reduced trend of β cell mass in Tg(ins:nfsB-mCherry) zebrafish larvae at 72 hpf, which were rescued by 5 mM Carnosine but not 10 μM PK11195 intervention. Grey box indicates the β cell mass area; White scale bar = 100 μm, grey scale bar = 50 μm. (B–C). Quantification of area size of the early pancreas (B) and β cell mass (C) in violin plots, n = 17–26 per group. (D) 4-HNE incubation led to increased IOC branch diameters (white arrow) and sprouts (white delta) in hyaloid vasculature of Tg(fli1:EGFP) zebrafish larvae at 120 hpf, which were rescued via 10 μM PK11195 intervention. White scale bar = 20 μm. (E–F). Quantification of the IOC branch diameters and sprouts in violin plots, n = 10–20 per group. For statistical analysis one-way ANOVA followed by Sidak's multiple comparison test was applied, *p < 0.05, **p < 0.01, ***p < 0.001, ****p < 0.0001. PHENOTYPE:
|

ZFIN is incorporating published figure images and captions as part of an ongoing project. Figures from some publications have not yet been curated, or are not available for display because of copyright restrictions. |