
Fig. 6
- ID
- ZDB-IMAGE-210216-65
- Publication
- Lou et al., 2020 - Elevated 4-hydroxynonenal induces hyperglycaemia via Aldh3a1 loss in zebrafish and associates with diabetes progression in humans
- All Figures
- Figures for Lou et al., 2020
|
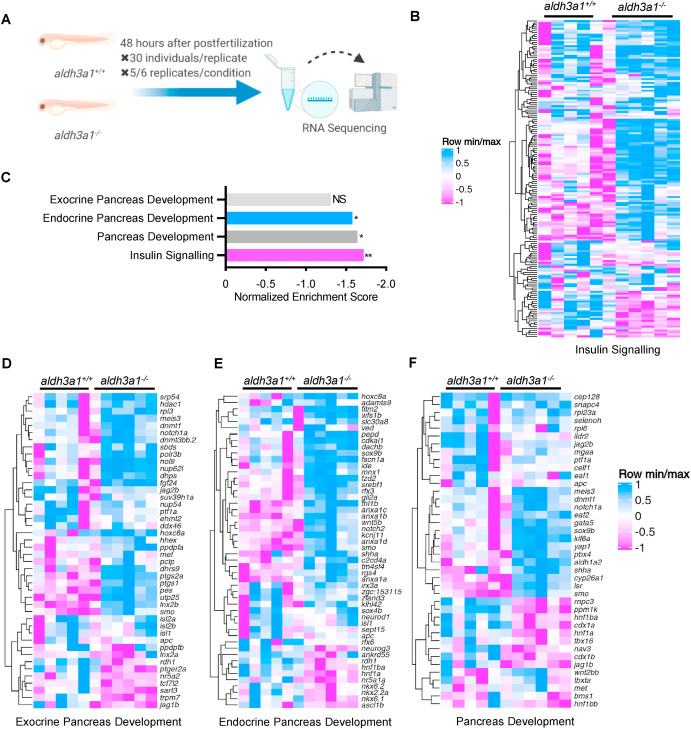
Fig. 6 Fig. 6. Down-regulated insulin signalling and endocrine but not exocrine pancreas development pathway in aldh3a1−/− zebrafish larvae. (A). Schematic diagram of larval RNA-Seq. 30 larvae per clutch, 5 clutches of aldh3a1+/+ and 6 clutches of aldh3a1−/− zebrafish larvae at 48 hpf was used for RNA isolation. (B–C). RNA-Seq Heatmap showed relative mRNA expression in insulin signalling pathway (B), which was significantly down-regulated in aldh3a1−/− larvae via KEGG analysis (C), **p = 0.003. (D–F). RNA-Seq Heatmap showed relative mRNA expression in exocrine (D), endocrine (E) and whole (F) pancreas development pathway, and endocrine but not exocrine pancreas development pathway was significantly down-regulated in GSEA analysis(C). The higher and lower expression is displayed in pink and blue, respectively. Adjust p value: *p < 0.05, **p < 0.01; NS, not significant; GSEA, gene set enrichment analysis; KEGG, kyoto encyclopedia of genes and genomes.