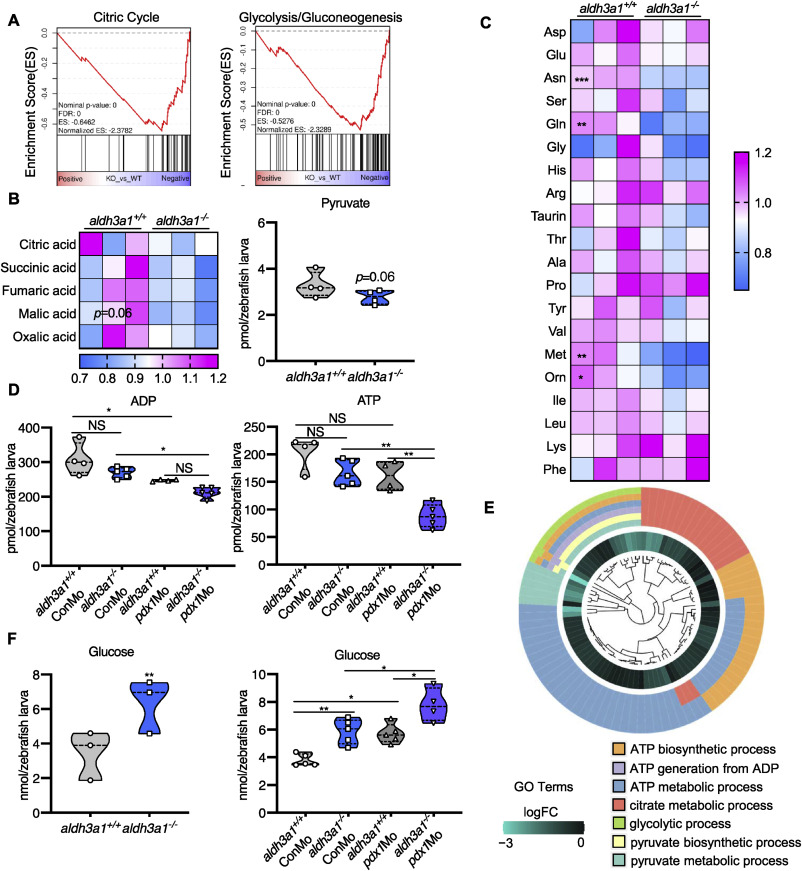
Fig. 7 Fig. 7. Aldh3a1 knockout zebrafish larvae exhibited impaired glucose homeostasis and can be further aggravated by endogenous pdx1 expression silencing. (A). RNA-Seq GSEA analysis showed down-regulated expression of Citric Cycle and Glycolysis/Gluconeogenesis at 48 hpf; And (B) the intermediates of Citric Cycle and pyruvate showed a decreased trend at 96 hpf in aldh3a1−/− zebrafish larvae. (C). Amino acid profile displayed several reduced glycogenic amino acids, including Asn, Gln and Met in aldh3a1−/− larvae at 96 hpf. (D) ADP and ATP showed decreased levels in aldh3a1−/− larvae and achieved significantly lowest ATP and ADP levels with pdx1 silencing at 96hpf; (E). All these metabolomic changes were further confirmed via RNA-Seq GO pathway enrichment analysis, and all core genes showed down-regulated logFC value in the involved seven pathways. (F). Increased glucose level was determined in aldh3a1−/− larvae at 48 hpf, while pdx1 silencing enhanced the impaired glucose homeostasis. 6 ng of each morpholino was injected into the one-cell stage of zebrafish embryos respectively. n = 3–6 as each violin plot or heatmap showed. For statistical analysis, paired samples t-tests or one-way ANOVA followed by Sidak's multiple comparison test was applied, *p < 0.05, **p < 0.01, ***p < 0.001. Asn, asparagine; Gln, glycine; Met, methionine.
Image
Figure Caption
Figure Data
Acknowledgments
This image is the copyrighted work of the attributed author or publisher, and
ZFIN has permission only to display this image to its users.
Additional permissions should be obtained from the applicable author or publisher of the image.
Full text @ Redox Biol.

