
|
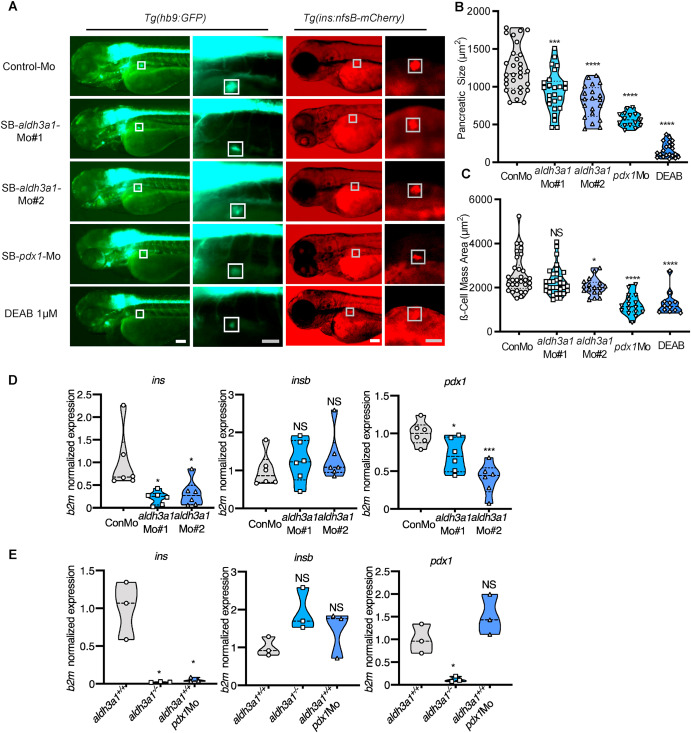
Fig. 5 Fig. 5. Primary pancreas was disrupted by ALDH inhibition, aldh3a1 transient silencing and permanent knockout in zebrafish larvae. (A). ALDH inhibition by DEAB treatment, and endogenous aldh3a1 expression silencing induced decreased dimensions of the primary pancreas in Tg(hb9:GFP) and a reduced sign of β cell mass area in Tg(ins:nfsB-mCherry) zebrafish larvae at 72 hpf. White box indicates the primary pancreas; Grey box indicates the β cell mass area; White scale bar = 100 μm, grey scale bar = 50 μm. (B–C). Quantification of area size of the primary pancreas (B) and β cell mass(C) in violin plots, n = 12–33 per group. (D–E). Similar to pdx1 morpholino mediated silencing (E), ins mRNA expression was decreased significantly in both aldh3a1 silencing(D) and Aldh3a1 permanent knockout (E) zebrafish larvae at 48 hpf, while insb was unaltered. Expression of mRNA was analysed by RT-qPCR and was normalized to b2m. The average values of Control-Mo injected (D) and aldh3a1+/+ zebrafish larvae (E) were standardized to 1, n = 3–6 clutches with 30 larvae per group. 6 ng of each morpholino was injected into the one-cell stage of zebrafish embryos, respectively. For statistical analysis one-way ANOVA followed by Sidak's multiple comparison test was applied, *p < 0.05, ***p < 0.001, ****p < 0.0001. Mo, morpholino; NS, not significant; ins, preproinsulin; insb, preproinsulin b; DEAB, N,N-diethylaminobenzaldehyde.