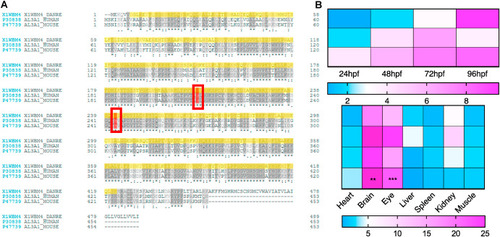
Fig. 1. Sequence alignment of Aldh3a1 across different species and expression of aldh3a1 mRNA in zebrafish. (A). Amino acid alignment showed a high similarity and same active sites (red frame) between different species: First line, zebrafish Aldh3a1; Second line, human ALDH3A1; Third line, mouse ALDH3A1. (B). Heatmap of aldh3a1 mRNA expression in wild type zebrafish showed an increasing trend from 24 hpf to 96 hpf in larvae, and brain and eye were the most expressed adult organs. The higher and lower expression is displayed in pink and blue, respectively. Expression of genes was determined by RT-qPCR and normalized to b2m. The average values of 24 hpf wild type larvae and heart (adult organs) were standardized to 1; Larvae: n = 3 clutches with 30 larvae, adult organs: n = 4 with one organ per sample. For statistical analysis one-way ANOVA followed by Sidak's multiple comparison test was applied, **p < 0.01, ***p < 0.001. RT-qPCR, real-time quantitative polymerase chain reaction; hpf, hours after post fertilization; b2m, β2 microglobulin. (For interpretation of the references to colour in this figure legend, the reader is referred to the Web version of this article.)
|
