
- Title
-
Synaptically silent sensory hair cells in zebrafish are recruited after damage
- Authors
- Zhang, Q., Li, S., Wong, H.C., He, X.J., Beirl, A., Petralia, R.S., Wang, Y.X., Kindt, K.S.
- Source
- Full text @ Nat. Commun.
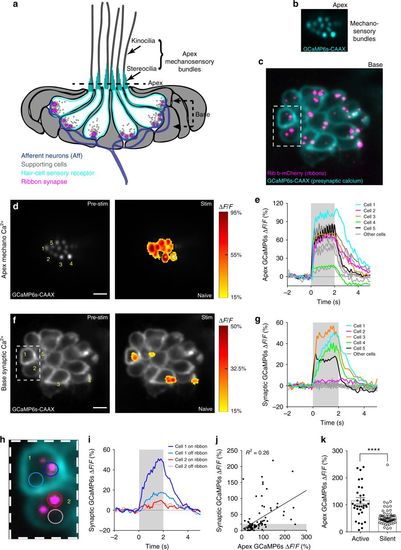
Hair-cell mechanosensation and presynaptic Ca2+ activities. a Cartoon neuromast organ illustrating hair cells (cyan) with apical mechanosensory bundles, basal presynaptic ribbons (magenta), supporting cells (gray), and the associated afferent processes (blue). Bundles made up of stereocilia (cyan) and kinocilia (gray) are oriented to respond to either anterior or posterior stimuli. b, c Images of a double transgenic neuromast expressing GCaMP6s-CAAX (labels apical and basal hair-cell membranes) and Ribeye b-mCherry (labels presynaptic ribbons) in hair cells. A top-down cross-section reveals mechanosensory bundles (b), or the synaptic plane (c). d, f Functional Ca2+ imaging acquired from the neuromast in b, c during a 2-s 5 Hz (anterior–posterior directed square wave) mechanical stimulus that stimulates all hair cells. Spatial patterns of GCaMP6s Ca2+ signals during stimulation (right panels) are colorized according to the ∆F/F heat maps and superimposed onto a baseline GCaMP6s images (left panels). At the apex, robust mechanosensitive Ca2+ signals are detected in nearly all bundles (d), while only a subset of hair cells shows robust presynaptic Ca2+ signals at their base (f). e, g Temporal curves of mechanosensitive (1.5 μm ROIs) or presynaptic (3 μm ROIs) Ca2+ responses of all 16 hair cells in this example, highlighting four cells with robust presynaptic Ca2+ signals (cells 1, 3, 4, 5, labeled in d, f). h Enlarged image of the dashed box in c and f highlights an active (cell 1) and a silent (cell 2) cell. i Using 1.5 μm ROIs (h), in cell 1, the Ca2+ signals are larger on ribbons compared to off ribbon (blue traces) while in cell 2, Ca2+ signals off and on the ribbon are similar (red traces). j In response to an unsaturated stimulus, there is a slight correlation between presynaptic and mechanosensitive Ca2+ signals, R2 = 0.26, n = 94 cells. k Using a threshold of ∆F/F = 20%, the active and silent cells in j were separated. Mechanosensitive responses were on average larger in active cells (115.1% ± 11.79, n = 35) versus inactive cells (54.71 ± 4.44, n = 59). A Wilcoxon test was used in k; ***p < 0.0001. Scale bars = 5 μm |
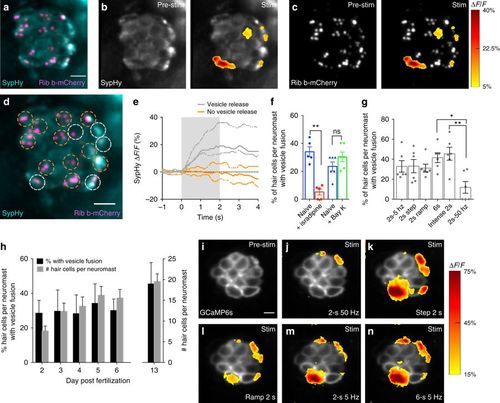
Presynaptic vesicle fusion occurs in a subset of hair cells. a Neuromast hair cells expressing SypHy (vesicle fusion, cyan) and Ribeye b-mCherry (ribbons, magenta). b, c Spatial patterns of SypHy signals during a 2-s 5 Hz stimulation (right panels) are colorized according to the ∆F/F heat map and superimposed onto a baseline SypHy image (b, left panel) or onto an image of ribbons (c, left panel). Only a subset of the hair cells display vesicle fusion. d Dashed circles indicate ROIs (3 µm diameter) used to detect SypHy signals from example in a–c. e Plot of SypHy signals (mean with upper and lower limits) from cells in d from five cells with (white) and eight cells without (orange) vesicle fusion. f The % of hair cells per neuromast with vesicle fusion (naïve blue, 34.04% ± 3.55, n = 5 neuromasts) decreases after 10 µM isradipine treatment (red, 5.20% ± 2.16, p = 0.007), but is not altered (naïve blue, 23.50% ± 3.20, n = 6 neuromasts) after 10 µM Bay K treatment (green, 30.33% ± 3.48, p = 0.10). g The % of hair cells per neuromast with vesicle fusion in response to different stimuli, n = 6 neuromasts per stimulus. h The % of hair cells per neuromast with vesicle fusion does not vary during development despite the increase in hair-cell number, n = 6 neuromasts per age. The % of cells with a SypHy response at day 2 (28.57% ± 3.01) is not different from day 13 (45.47% ± 5.46), p = 0.11. i–n The same subset of hair cells has robust presynaptic Ca2+ signals in response to a variety of stimuli, n = 5 neuromasts. Similar to g, in j, fewer active cells are observed in response to a 2-s 50 Hz stimulus. A paired t-test was used for comparisons in f. A one-way ANOVA, df = 30 or 2-way ANOVA, df = 25, with post-hoc Tukey’s test to correct for multiple comparisons were used in g and h, respectively; *p < 0.05, **p < 0.01. Scale bars = 5 μm |
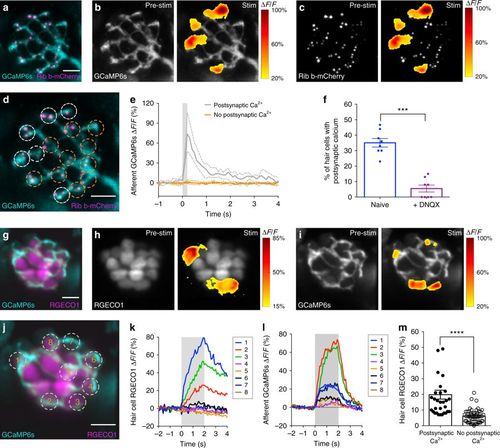
Robust hair-cell Ca2+ influx corresponds with postsynaptic Ca2+ responses. a A double transgenic line with afferent neurons expressing GCaMP6s-CAAX to detect postsynaptic Ca2+ activity (cyan) and hair cells expressing Ribeye b-mCherry to label ribbons (magenta). b, c Representative neuromast demonstrating spatial patterns of afferent GCaMP6s signals during a 200-ms step stimulation (right panels). GCaMP6s signals correspond to the ∆F/F heat map and are superimposed onto the baseline GCaMP6s image (b, left panel) or relative to presynaptic ribbons (c, left panel). Only a subset of hair cells is associated with postsynaptic Ca2+ activity. d Dashed circles indicate ROIs (diameter of 3 µm) used to detect afferent Ca2+ signals. e Plot of the postsynaptic Ca2+ signals in the six cells with (white) and 10 cells without (orange) postsynaptic Ca2+ activities (mean with upper and lower limits plotted). f The percentage of hair cells associated with afferent Ca2+ activity (naive blue, 35% ± 2.76) is decreased after 10 µM DNQX treatment (purple, 5.50 ± 2.24) to block postsynaptic AMPA receptors, n = 8 neuromasts, p < 0.0001. g Double transgenic with hair cells expressing RGECO1 (magenta) and afferent neurons expressing GCaMP6s-CAAX (cyan). h–l RGECO1 and GCaMP6s responses acquired from the same neuromast organ during a 2-s 5 Hz (anterior–posterior directed square wave) stimulus that activates all hair cells. Hair-cell RGECO1 (h, right panel) or afferent GCaMP6s (i, right panel) responses during stimulation are superimposed onto the baseline grayscale images (h, i, left panels). j–l 10 ROIs (3 µm) outlined in j were used to generate plots of the hair-cell RGECO1 Ca2+ (k) or GCaMP6s afferent Ca2+ (l) signals. Hair cells with strong Ca2+ influx (cells 1–3, k) also have afferent Ca2+ signals (l). m RGECO1 hair-cell Ca2+ signals associated with afferent Ca2+ signals (19.84% ± 2.38, n = 31 cells) were larger than those without (6.04% ± 0.62, n = 50 cells), p> 0.0001. A paired t-test was used in f, a Mann–Whitney test was used in m; ***p < 0.001, ****p < 0.0001. Scale bars = 5 μm |
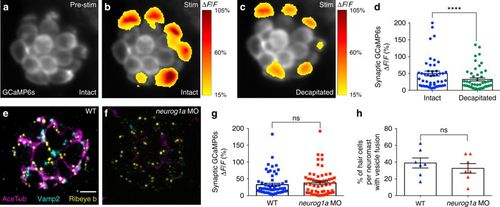
The proportion of active cells is not dependent on innervation. a–c Presynaptic Ca2+ profiles of a representative neuromast in response to a 2-s 5 Hz (anterior–posterior directed square wave) stimulus that activates all hair cells, before (b) and after decapitation to eliminate efferent activity (c). Spatial patterns of GCaMP6s Ca2+ activities during stimulation are colorized according to the ∆F/F heat map and superimposed onto the baseline GCaMP6s image (a). d Presynaptic Ca2+ responses before (49.90% ± 7.24) and after decapitation (32.31% ± 4.70), n = 50 cells, p < 0.0001. Immunostaining of a wild-type (WT, e) and neurog1a morphant (MO, f) neuromast. Ribeye b labels presynaptic ribbons (yellow), Acetylated Tubulin (AceTub, magenta) labels afferent neurons, and Vamp2 (cyan) labels efferent neurons. The neurog1 morphants lack afferent (magenta) and efferent (cyan) innervation. g There is no significant difference in the magnitude of the presynaptic Ca2+ responses between the WT (32.64% ± 4.36) and neurog1a morphants (37.73% ± 4.93), n = 59 hair cells, p = 0.79. h There is no significant difference in the percentage of hair cells with vesicle fusion per neuromast between WT (38.94% ± 5.97) and neurog1a morphants (32.53% ± 5.75), n = 7 neuromasts, p = 0.45. A Wilcoxon test was used in d, a Mann–Whitney test in g, and an unpaired t-test in h; ****p < 0.0001. Scale bars = 5 μm |
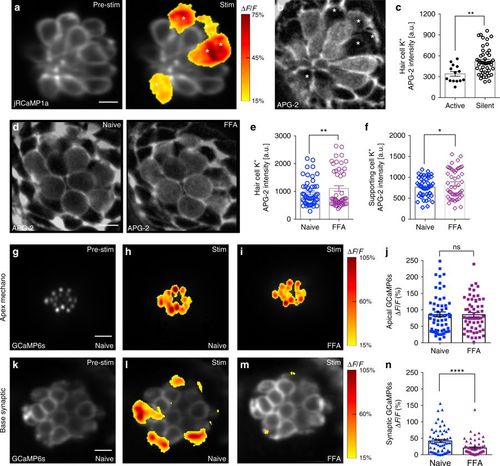
Low [K+] and gap junctions may facilitate presynaptic activity. a Presynaptic Ca2+ jRCaMP1a Ca2+ signals during a 2-s 5 Hz stimulus. Spatial patterns of jRCaMp1a Ca2+ signals during stimulation are colorized according to the ∆F/F heat maps and superimposed onto a pre-stimulus baseline jRCaMP1a image (a, left panel). b Image of the same neuromast as a after labeling with the K+ indicator, APG-2. The active cells in a and b are marked with asterisks. c Quantification of APG-2 intensity shows that active cells (341.1 a.u. ± 33.17, n = 14 cells) have lower resting [K+]in levels than silent cells (520.1 a.u. ± 28.37, n = 46 cells) p = 0.001. d APG-2 dye labeling before (d, left panel) and after (d, right panel) FFA treatment to block gap junctions. e, f Quantification of APG-2 intensity shows 25 µm FFA significantly increases [K+]in levels in hair cells (naïve: 950.2 a.u. ± 67.9; after FFA: 1105 a.u. ± 99.7, n = 48 cells, p = 0.01) and in supporting cells (naïve: 767.1 a.u. ± 34.4; after FFA: 845.1 a.u. ± 50.3, n = 48 cells, p = 0.015). g–i, k–m Mechanosensitive and presynaptic GCaMP6s Ca2+ signals within the same cells before and after application of 25 μM FFA. Mechanosensative (h) and presynaptic (l) Ca2+ signals during a 2-s 5 Hz stimulus prior to drug treatment; 25 μM FFA does not alter mechanotransduction (i) but decreases presynaptic Ca2+ responses (m). Spatial patterns of GCaMP6s Ca2+ signals during stimulation are colorized according to the ∆F/F heat maps and superimposed onto baseline GCaMP6s images (g, k). j Quantifications of the mechanosensitive Ca2+ signals show no significant differences before (86.10% ± 7.55) and after 25 μM FFA (85.18% ± 6.64), n = 60 hair cells, p = 0.76. n In the same cells as j, presynaptic Ca2+ signals (41.55% ± 4.85) are significantly decreased after FFA application (20.27% ± 3.07), n = 60 cells, p < 0.0001. A Mann–Whitney test was used in c, a Wilcoxon test was used in e, f, j, and n; *p < 0.05, **p < 0.01, ****p < 0.0001. Scale bars = 5 μm |
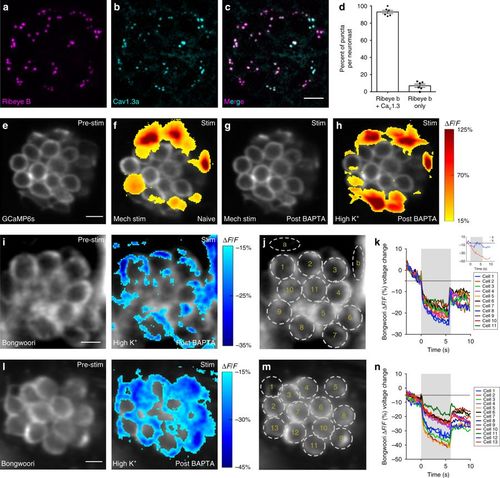
Depolarization does not activate CaV1.3 channels in all cells. a–c Example neuromast with immunostain labeling presynaptic ribbons (Ribeye b, magenta) in a, and presynaptic CaV1.3a channels (cyan) in b. Images in a and b are merged in c. d Quantification of the percent of Ribeye b positive ribbons per neuromast that colocalize with CaV1.3a (93.00% ± 1.93, n = 10 neuromasts). e–h Representative neuromast demonstrating spatial patterns of hair-cell presynaptic GCaMP6s Ca2+ signals during mechanical and high K+ stimulation. Signals are colorized according to the ∆F/F heat map and superimposed onto baseline GCaMP6s image (e). f A subset of cells shows presynaptic Ca2+ signals in response to a 2-s 5 Hz mechanical stimulus. g All mechanical responses are eliminated after BAPTA treatment. h After BAPTA treatment, to depolarize hair cells, high K+ was applied (via the fluid jet). High K+ application activates the same cells as the original mechanical stimulus (f). i, l Example neuromasts demonstrating spatial patterns of hair-cell Bongwoori voltage signals during high K+ stimulation. Spatial patterns of Bongwoori voltage signals during high K+ stimulation are colorized according to the ∆F/F heat map and superimposed onto baseline Bongwoori image (i, l, left panels). k, n Using 5 µm ROIs shown in j, m, all cells show depolarization in response to high K+ application. Inset in k demonstrates that changes in Bongwoori signals in the background skin pigment (ROIs a, b) do no correlate with the stimulus. Scale bars = 5 μm |
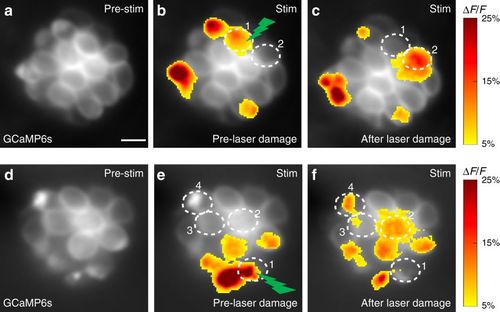
Laser damage to an active cell activates silent cells. a–f Presynaptic GCaMP6s signals from two representative neuromast organs before and after laser damage. b, e Presynaptic Ca2+ signals during a 2-s step stimulus (anterior and posterior responses are merged in the profile) prior to laser damage. Spatial patterns of GCaMP6s Ca2+ signals during stimulation are colorized according to the ∆F/F heat map and superimposed onto baseline GCaMP6s images (a, d). c, f Presynaptic Ca2+ signals after high power laser-induced damage to one active cell in each neuromast (green lightning bolt, cell 1 in b and e). After laser damage, the damaged cell (cell 1) no longer displays a detectable presynaptic Ca2+ signal, but new cells now display robust presynaptic Ca2+ signals (cell 2 in c and cells 2–4 in f). Scale bars = 5 μm |
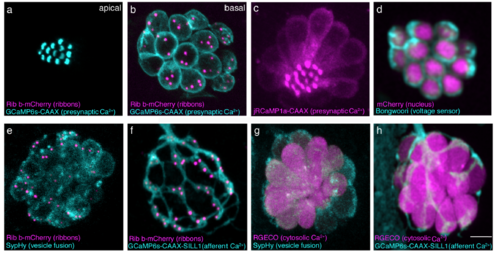
Zebrafish transgenic lines for functional imaging. (a-b) Top-down view of a double transgenic neuromast expressing a membrane localized Ca2+ indicator, GCaMP6s-CAAX (cyan) and Ribeye b-mCherry (magenta) to label presynaptic ribbons in hair cells. An apical GCaMP6s-CAAX plane is used to examine mechanosensative Ca2+ influx in the mechanosensory hair bundles (a) while a plane at the base of the same neuromast can be used to monitor presynaptic Ca2+ influx at ribbons (b). (c) Similar to GCaMP6s-CAAX, red-shifted jRCaMP1a-CAAX (magenta) can measure apical or basal Ca2+ influx in hair cells. (d) Bongworri (cyan) can be used to detect membrane voltage changes in hair cells. (e) A double transgenic line expressing SypHy (cyan), an indicator of vesicle fusion and Ribeye b-mCherry (magenta) in hair cells can be used to monitor vesicle fusion at presynaptic ribbons. (f) Postsynaptic afferents expressing GCaMP6s-CAAX (cyan), along with expression of Ribeye b-mCherry (magenta) in hair cells enables monitoring of postsynaptic Ca2+ signals adjacent to presynaptic ribbons. (g) Cells expressing SypHy (cyan) and RGECO1 (magenta), a red cytosolic Ca2+ indicator enable dual monitoring of hair-cell Ca2+ and vesicle fusion. (h) A double transgenic with postsynaptic afferents expressing GCaMP6s-CAAX (cyan) and hair cells expressing RGECO1 (magenta) enable monitoring of pre- and post-synaptic Ca2+ activities respectively. Scale bar = 5 μm. |
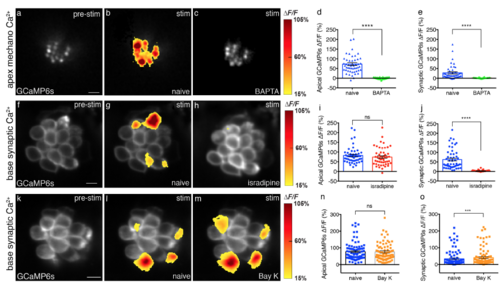
Effect of BAPTA, isradipine and Bay K on mechanosensitive Ca2 and presynaptic Ca2+profiles of hair cells. (a-c) Apical mechanosensitive bundle Ca2+profiles of a single neuromast in response to a 2-s 5 Hz (anterior-posterior directed square wave) stimulus that activates all hair cells before (b) and after 5 mM BAPTA treatment (c). Spatial patterns of Ca2+ signals during stimulation are colorized according to the ΔF/F heat maps and superimposed onto the pre-stimulus baseline image (a). (d-e) Apical (naïve: 68.54 % ± 6.26; after BAPTA: 0.60 % ± 0.71, n = 46 cells, p < 0.0001) and presynaptic (naïve: 23.07 % ± 6.03; after BAPTA: 2.17 % ± 0.48, n = 46 cells, p < 0.0001) Ca2+ signals are both significantly decreased after 5 mM BAPTA treatment. (f-h) Presynaptic hair cell Ca2+profiles of a single neuromast in response to a 2-s 5 Hz (anterior-posterior directed square wave) stimulus that activates all hair cells before (g) and after 10 μM isradipine treatment (h). Spatial patterns of Ca2+ signals during stimulation are colorized according to the ΔF/F heat maps and superimposed onto the pre-stimulus baseline image (f). (i-j) After 10 μM isradipine treatment, apical Ca2+ signals (naïve: 82.52 % ± 5.85; after isradipine: 74.31 % ± 6.37, n = 51 cells, p = 0.13) show no significant difference, but presynaptic Ca2+ signals (naïve: 62.40 % ± 7.05; after isradipine: 3.51 % ± .49, n = 51 cells, p < 0.0001) are significantly decreased. (k-m) Presynaptic hair cell Ca2+profiles of a single neuromast in response to a 2-s 5 Hz (anterior-posterior directed square wave) stimulus that activates all hair cells before (l) and after 5 μM Bay K treatment (m). Spatial patterns of Ca2+ signals during stimulation are colorized according to the ΔF/F heat maps and superimposed onto the prestimulus baseline image (k). (n-o) After Bay K application, apical Ca2+ signals (naïve: 77.19 % ± 5.98; after Bay K: 76.01 ± 6.40, n = 94 cells, p = 0.51) show no significant difference, while presynaptic Ca2+ signals (naïve: 34.02 % ± 4.76; after bayK: 41.12 % ± 5.26, n = 94 cells, p = 0.0001) show significant increases. A Wilcoxon test was used in (d-e), (i-j), and (n-o), ***p < 0.001. ****p < 0.0001. Scale bars = 5 μm. |
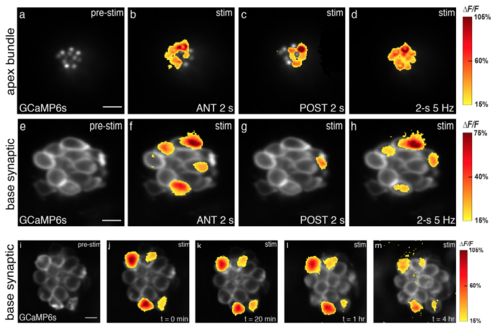
Two main stimulus types used in experiments; presynaptic responses are stable over time. (a-d) Apical Ca2+ profiles in response to 2 s anterior stimulus (b), 2 s posterior stimulus (c) and 2-s 5 Hz frequency stimulus (d). (e-h) Preynaptic Ca2+ profiles from the same hair cells in (a-d), in response to 2 s anterior stimulus (f), 2 s posterior stimulus (g) and 2-s 5 Hz frequency stimulus (h). Spatial patterns of Ca2+ signals during stimulation are colorized according to the ΔF/F heat maps and superimposed onto pre-stimulus baseline images (a, e). (im) The same subset of cells had robust presynaptic Ca2+ influx over multiple trials with same stimulation after 20 min (k), 1 hr (l), and 4 hrs (m), n = 6 neuromasts. Spatial patterns of Ca2+ signals during stimulation are colorized according to the ΔF/F heat maps and superimposed onto pre-stimulus baseline image at each time point (ie: i for t = 0 min). Scale bars = 5 μm. |
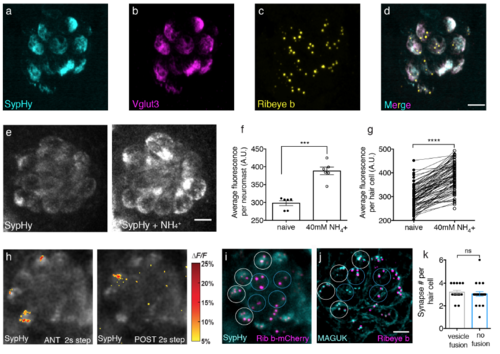
SypHy localizes to synaptic vesicles, and it is properly acidified; active and silent cells have the same number of synapses. (a-d) Immunostaining of a representative neuromast expressing SypHy. Merged image (d) shows SypHy (a, cyan) colocalizes with Vglut3 (b, magenta) near Ribeye b labeled presynaptic ribbons (c, yellow). (e) Example neuromast demonstrating that baseline SypHy signals (e, left panel) increase when SypHy is deacidified after 40 mM NH4 Cl treatment (e, right panel). (f-g) Quantification of baseline SypHy intensities after 40 mM NH4 Cl treatment. The average SypHy signal per neuromast (f) is increased (naïve: 298.00 a.u. ± 6.87; after 40 mM NH4 +: 388.40 a.u. ± 10.62, n = 6 neuromasts, p = 0.0007). All hair cells show an increase in baseline SypHy signal (g), (naïve: 297.40 a.u. ± 5.42; after 40 mM NH4 +: 387.30 a.u. ± 6.53, n = 85 cells, p < 0.0001). (h) SypHy signals in response to 2-s anterior (h, left panel) and 2-s posterior (h, right panel) step stimuli that cumulatively activate all hair cells. Spatial patterns of SypHy signals during stimulation are colorized according to the ΔF/F heat maps and superimposed onto a pre-stimulus baseline image. (i) Live image of hair cells from the same neuromast as (h) expressing SypHy (cyan) and Ribeye b-mCherry (magenta). (j) The same neuromast as in (h-i), after immunostaining to label postsynaptic MAGUK (cyan) and presynaptic Ribeye b (magenta). White circles mark hair cells with vesicle fusion and blue circles indicate cells with no vesicle fusion. (k) Quantification of the number of synapses per individual hair cell based on MAGUK and Ribeye b staining show similar number of synapses between cells with (3.20 ± 1.18, n = 15 cells) and without (3.05 ± 0.20, n = 22 cells) vesicle fusion, p = 0.39, day 6 4-5. A paired t-test was used in (f-g), and a Mann-Whitney test was used in (k), ***p < 0.001, ****p < 0.0001. Scale bars = 5 μm. |
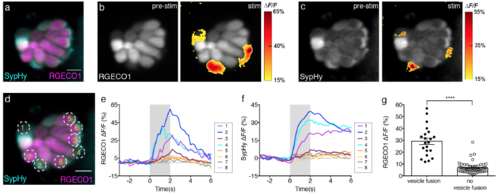
Hair cells with vesicle fusion correlate with strong cytosolic Ca2+ influx. (a) Double transgenic neuromast co-expressing RGECO1 (magenta) and SypHy (cyan) in hair cells. (b-c) RGECO1 and SypHy responses acquired from the same neuromast organ during a 2-s 5 Hz (anterior-posterior directed square wave) stimulus that activates all hair cells. Spatial patterns of RGECO1 Ca2+ activities (b, right panel) or SypHy vesicle fusion (c, right panel) during stimulation are colorized according to the ΔF/F heat maps and superimposed onto pre-stimulus baseline grayscale image RGECO1 (b, left panel) or SypHy (c, left panel) image. (d) Combined color image of SypHy (cyan) and RGECO1 (magenta), with 8 hair cells outlined with ROIs (3 μm). (e-f) Temporal curves of RGECO1 Ca2+ signals (e) and SypHy vesicle fusion signals (f) from the 8 ROIs drawn in (d). Hair cells (cells 1, 2, 4) with stronger Ca2+ influx (e) also have detectable vesicle fusion (f). (g) RGECO1 Ca2+ signal magnitude is greater in hair cells with (ΔF/F, 29.18 % ± 2.75, n = 21 cells) than without (ΔF/F, 6.70 % ± 0.58, n = 58 cells) detectable SypHy signals, p< 0.0001. A Mann Whitney test was used in (g), **** p < 0.0001. Scale bars = 5 μm. |
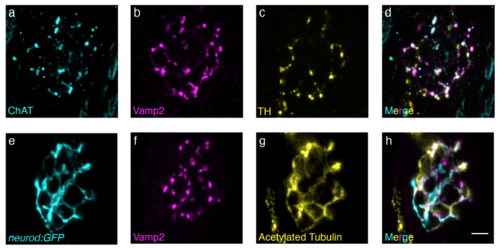
Dopaminergic and cholinergic efferent neurons innervate lateral-line neuromasts. (a-d) Neuromast immunostaining of ChAT (cyan, a) and TH (yellow, c) label cholinergic and dopaminergic efferents respectively. Colocalization of Vamp2 (magenta, b), a neuronal presynaptic marker, with ChAT and TH (d) demonstrates that both types of efferents make presynaptic contacts on or near neuromasts. (e-h) Neuromast afferents expressing neurod:GFP (cyan, e) demonstrate that cumulatively, Acetylated tubulin (yellow, g) and Vamp2 (magenta, f) immunostaining can be used to label afferent and efferent innervation respectively. Scale bar = 5 μm. |
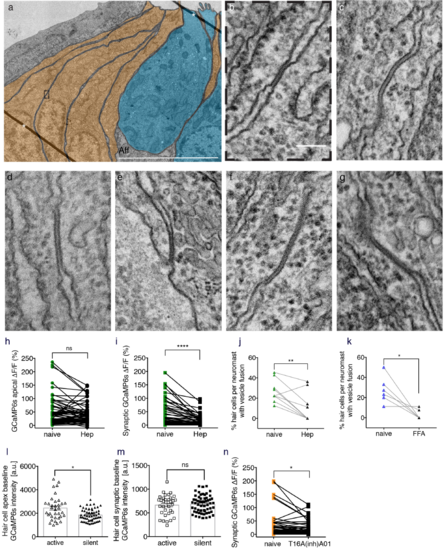
Gap junctions between supporting cells are important for presynaptic function in hair cells. (a) A representative transmission electron microscopy (TEM) image of a neuromast with hair cells colorized in blue and supporting cells in orange. (b) 9 Enlarged image of the dashed box in (a) reveals a cross section through a gap junction between two supporting cells. (c-g) Additional examples of a gap junction between two supporting cells. (h) Mechanosensitive Ca2+ signals show no significant differences before and after 3 mM heptanol treatment (naïve: 48.69 % ± 6.26; heptanol: 39.82 % ± 4.37, n = 68 cells, p = 0.07). (i) In the same neuromast organs as (h), presynaptic Ca2+ signals are significantly decreased after 3 mM heptanol treatment (naïve: 33.13 % ± 5.27: heptanol: 13.49 % ± 2.26, n = 70 cells, p < 0.0001). (j, k) The percentage of hair cells with vesicle fusion per neuromast is significantly decreased after 3 mM heptanol treatment (naïve: 26.46 % ± 3.35; heptanol: 10.62 % ± 4.42, n = 10 neuromasts, p = 0.003) and 25 μM FFA treatment (naïve: 27.41 % ± 5.42; FFA: 3.31 % ± 2.02, n = 6 neuromasts, p = 0.02). (l) Using GCaMP6s, there are slight differences in the resting bundle Ca2+ levels in active (2446 a.u. ± 171.9, n = 35 cells) versus silent hair cells (1860 a.u. ± 66.74, n = 59 cells), p = 0.02. (m) In the same neuromast organs as (l), there are no significant differences in the resting presynaptic Ca2+ levels between active (664.3 a.u. ± 35.84, n = 35 cells) and silent hair cells (685.4 a.u. ± 23.58, n = 59 cells), p = 0.81. (n) Using 10 μm of the chloride channel blocker T16(inh)-A01, there was a significant decrease in presynaptic Ca2+ signals (naïve: 24.67 % ± 5.32: T16(inh)-A01: 16.62 % ± 3.00, n = 66 cells, p = 0.02). Asterisks in (a) indicate lines that are folds in the section. Aff = afferent process. A Wilcoxon test was used in (h-i, n), a paired t-test in (j-k), and a Mann-Whitney test in (l-m), *p <0.05, **p <0.01, ****p <0.0001, Scale bar = 5 μm in (a) and it is 100 nm in (b-f) . |