
Fig. S7
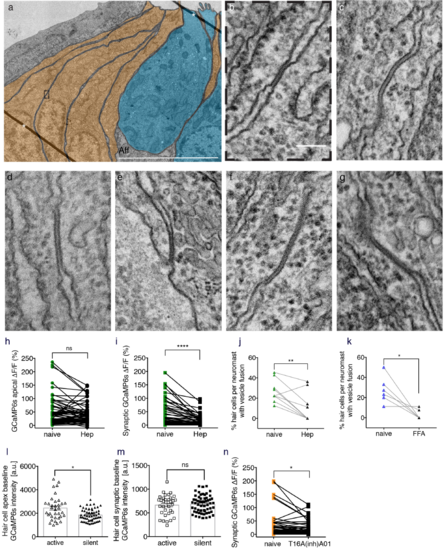
Gap junctions between supporting cells are important for presynaptic function in hair cells. (a) A representative transmission electron microscopy (TEM) image of a neuromast with hair cells colorized in blue and supporting cells in orange. (b) 9 Enlarged image of the dashed box in (a) reveals a cross section through a gap junction between two supporting cells. (c-g) Additional examples of a gap junction between two supporting cells. (h) Mechanosensitive Ca2+ signals show no significant differences before and after 3 mM heptanol treatment (naïve: 48.69 % ± 6.26; heptanol: 39.82 % ± 4.37, n = 68 cells, p = 0.07). (i) In the same neuromast organs as (h), presynaptic Ca2+ signals are significantly decreased after 3 mM heptanol treatment (naïve: 33.13 % ± 5.27: heptanol: 13.49 % ± 2.26, n = 70 cells, p < 0.0001). (j, k) The percentage of hair cells with vesicle fusion per neuromast is significantly decreased after 3 mM heptanol treatment (naïve: 26.46 % ± 3.35; heptanol: 10.62 % ± 4.42, n = 10 neuromasts, p = 0.003) and 25 μM FFA treatment (naïve: 27.41 % ± 5.42; FFA: 3.31 % ± 2.02, n = 6 neuromasts, p = 0.02). (l) Using GCaMP6s, there are slight differences in the resting bundle Ca2+ levels in active (2446 a.u. ± 171.9, n = 35 cells) versus silent hair cells (1860 a.u. ± 66.74, n = 59 cells), p = 0.02. (m) In the same neuromast organs as (l), there are no significant differences in the resting presynaptic Ca2+ levels between active (664.3 a.u. ± 35.84, n = 35 cells) and silent hair cells (685.4 a.u. ± 23.58, n = 59 cells), p = 0.81. (n) Using 10 μm of the chloride channel blocker T16(inh)-A01, there was a significant decrease in presynaptic Ca2+ signals (naïve: 24.67 % ± 5.32: T16(inh)-A01: 16.62 % ± 3.00, n = 66 cells, p = 0.02). Asterisks in (a) indicate lines that are folds in the section. Aff = afferent process. A Wilcoxon test was used in (h-i, n), a paired t-test in (j-k), and a Mann-Whitney test in (l-m), *p <0.05, **p <0.01, ****p <0.0001, Scale bar = 5 μm in (a) and it is 100 nm in (b-f) . |