
Fig. 3
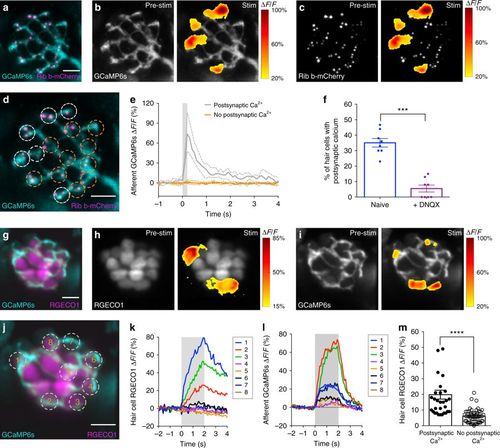
Robust hair-cell Ca2+ influx corresponds with postsynaptic Ca2+ responses. a A double transgenic line with afferent neurons expressing GCaMP6s-CAAX to detect postsynaptic Ca2+ activity (cyan) and hair cells expressing Ribeye b-mCherry to label ribbons (magenta). b, c Representative neuromast demonstrating spatial patterns of afferent GCaMP6s signals during a 200-ms step stimulation (right panels). GCaMP6s signals correspond to the ∆F/F heat map and are superimposed onto the baseline GCaMP6s image (b, left panel) or relative to presynaptic ribbons (c, left panel). Only a subset of hair cells is associated with postsynaptic Ca2+ activity. d Dashed circles indicate ROIs (diameter of 3 µm) used to detect afferent Ca2+ signals. e Plot of the postsynaptic Ca2+ signals in the six cells with (white) and 10 cells without (orange) postsynaptic Ca2+ activities (mean with upper and lower limits plotted). f The percentage of hair cells associated with afferent Ca2+ activity (naive blue, 35% ± 2.76) is decreased after 10 µM DNQX treatment (purple, 5.50 ± 2.24) to block postsynaptic AMPA receptors, n = 8 neuromasts, p < 0.0001. g Double transgenic with hair cells expressing RGECO1 (magenta) and afferent neurons expressing GCaMP6s-CAAX (cyan). h–l RGECO1 and GCaMP6s responses acquired from the same neuromast organ during a 2-s 5 Hz (anterior–posterior directed square wave) stimulus that activates all hair cells. Hair-cell RGECO1 (h, right panel) or afferent GCaMP6s (i, right panel) responses during stimulation are superimposed onto the baseline grayscale images (h, i, left panels). j–l 10 ROIs (3 µm) outlined in j were used to generate plots of the hair-cell RGECO1 Ca2+ (k) or GCaMP6s afferent Ca2+ (l) signals. Hair cells with strong Ca2+ influx (cells 1–3, k) also have afferent Ca2+ signals (l). m RGECO1 hair-cell Ca2+ signals associated with afferent Ca2+ signals (19.84% ± 2.38, n = 31 cells) were larger than those without (6.04% ± 0.62, n = 50 cells), p> 0.0001. A paired t-test was used in f, a Mann–Whitney test was used in m; ***p < 0.001, ****p < 0.0001. Scale bars = 5 μm |