
Fig. 1
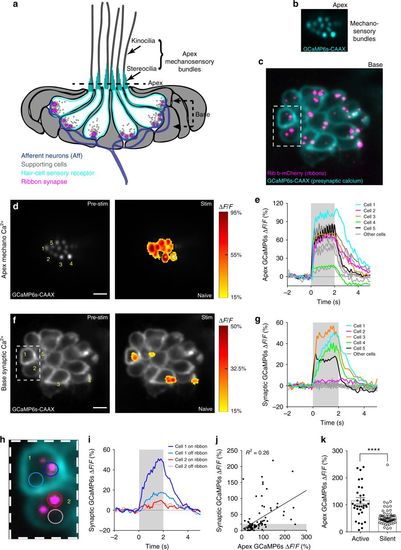
Hair-cell mechanosensation and presynaptic Ca2+ activities. a Cartoon neuromast organ illustrating hair cells (cyan) with apical mechanosensory bundles, basal presynaptic ribbons (magenta), supporting cells (gray), and the associated afferent processes (blue). Bundles made up of stereocilia (cyan) and kinocilia (gray) are oriented to respond to either anterior or posterior stimuli. b, c Images of a double transgenic neuromast expressing GCaMP6s-CAAX (labels apical and basal hair-cell membranes) and Ribeye b-mCherry (labels presynaptic ribbons) in hair cells. A top-down cross-section reveals mechanosensory bundles (b), or the synaptic plane (c). d, f Functional Ca2+ imaging acquired from the neuromast in b, c during a 2-s 5 Hz (anterior–posterior directed square wave) mechanical stimulus that stimulates all hair cells. Spatial patterns of GCaMP6s Ca2+ signals during stimulation (right panels) are colorized according to the ∆F/F heat maps and superimposed onto a baseline GCaMP6s images (left panels). At the apex, robust mechanosensitive Ca2+ signals are detected in nearly all bundles (d), while only a subset of hair cells shows robust presynaptic Ca2+ signals at their base (f). e, g Temporal curves of mechanosensitive (1.5 μm ROIs) or presynaptic (3 μm ROIs) Ca2+ responses of all 16 hair cells in this example, highlighting four cells with robust presynaptic Ca2+ signals (cells 1, 3, 4, 5, labeled in d, f). h Enlarged image of the dashed box in c and f highlights an active (cell 1) and a silent (cell 2) cell. i Using 1.5 μm ROIs (h), in cell 1, the Ca2+ signals are larger on ribbons compared to off ribbon (blue traces) while in cell 2, Ca2+ signals off and on the ribbon are similar (red traces). j In response to an unsaturated stimulus, there is a slight correlation between presynaptic and mechanosensitive Ca2+ signals, R2 = 0.26, n = 94 cells. k Using a threshold of ∆F/F = 20%, the active and silent cells in j were separated. Mechanosensitive responses were on average larger in active cells (115.1% ± 11.79, n = 35) versus inactive cells (54.71 ± 4.44, n = 59). A Wilcoxon test was used in k; ***p < 0.0001. Scale bars = 5 μm |