
Fig. 5
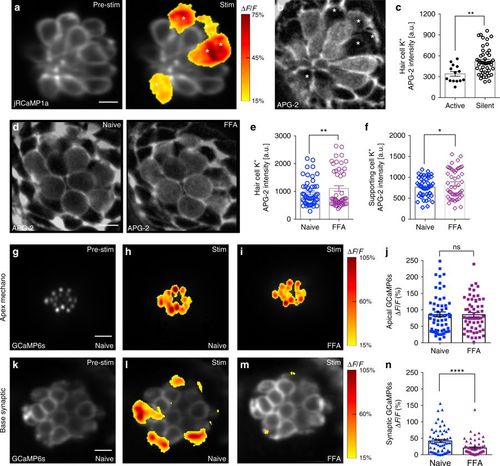
Low [K+] and gap junctions may facilitate presynaptic activity. a Presynaptic Ca2+ jRCaMP1a Ca2+ signals during a 2-s 5 Hz stimulus. Spatial patterns of jRCaMp1a Ca2+ signals during stimulation are colorized according to the ∆F/F heat maps and superimposed onto a pre-stimulus baseline jRCaMP1a image (a, left panel). b Image of the same neuromast as a after labeling with the K+ indicator, APG-2. The active cells in a and b are marked with asterisks. c Quantification of APG-2 intensity shows that active cells (341.1 a.u. ± 33.17, n = 14 cells) have lower resting [K+]in levels than silent cells (520.1 a.u. ± 28.37, n = 46 cells) p = 0.001. d APG-2 dye labeling before (d, left panel) and after (d, right panel) FFA treatment to block gap junctions. e, f Quantification of APG-2 intensity shows 25 µm FFA significantly increases [K+]in levels in hair cells (naïve: 950.2 a.u. ± 67.9; after FFA: 1105 a.u. ± 99.7, n = 48 cells, p = 0.01) and in supporting cells (naïve: 767.1 a.u. ± 34.4; after FFA: 845.1 a.u. ± 50.3, n = 48 cells, p = 0.015). g–i, k–m Mechanosensitive and presynaptic GCaMP6s Ca2+ signals within the same cells before and after application of 25 μM FFA. Mechanosensative (h) and presynaptic (l) Ca2+ signals during a 2-s 5 Hz stimulus prior to drug treatment; 25 μM FFA does not alter mechanotransduction (i) but decreases presynaptic Ca2+ responses (m). Spatial patterns of GCaMP6s Ca2+ signals during stimulation are colorized according to the ∆F/F heat maps and superimposed onto baseline GCaMP6s images (g, k). j Quantifications of the mechanosensitive Ca2+ signals show no significant differences before (86.10% ± 7.55) and after 25 μM FFA (85.18% ± 6.64), n = 60 hair cells, p = 0.76. n In the same cells as j, presynaptic Ca2+ signals (41.55% ± 4.85) are significantly decreased after FFA application (20.27% ± 3.07), n = 60 cells, p < 0.0001. A Mann–Whitney test was used in c, a Wilcoxon test was used in e, f, j, and n; *p < 0.05, **p < 0.01, ****p < 0.0001. Scale bars = 5 μm |