
Fig. S2
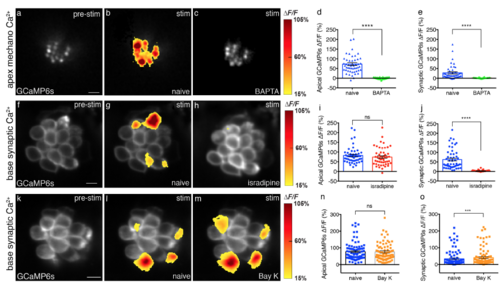
Effect of BAPTA, isradipine and Bay K on mechanosensitive Ca2 and presynaptic Ca2+profiles of hair cells. (a-c) Apical mechanosensitive bundle Ca2+profiles of a single neuromast in response to a 2-s 5 Hz (anterior-posterior directed square wave) stimulus that activates all hair cells before (b) and after 5 mM BAPTA treatment (c). Spatial patterns of Ca2+ signals during stimulation are colorized according to the ΔF/F heat maps and superimposed onto the pre-stimulus baseline image (a). (d-e) Apical (naïve: 68.54 % ± 6.26; after BAPTA: 0.60 % ± 0.71, n = 46 cells, p < 0.0001) and presynaptic (naïve: 23.07 % ± 6.03; after BAPTA: 2.17 % ± 0.48, n = 46 cells, p < 0.0001) Ca2+ signals are both significantly decreased after 5 mM BAPTA treatment. (f-h) Presynaptic hair cell Ca2+profiles of a single neuromast in response to a 2-s 5 Hz (anterior-posterior directed square wave) stimulus that activates all hair cells before (g) and after 10 μM isradipine treatment (h). Spatial patterns of Ca2+ signals during stimulation are colorized according to the ΔF/F heat maps and superimposed onto the pre-stimulus baseline image (f). (i-j) After 10 μM isradipine treatment, apical Ca2+ signals (naïve: 82.52 % ± 5.85; after isradipine: 74.31 % ± 6.37, n = 51 cells, p = 0.13) show no significant difference, but presynaptic Ca2+ signals (naïve: 62.40 % ± 7.05; after isradipine: 3.51 % ± .49, n = 51 cells, p < 0.0001) are significantly decreased. (k-m) Presynaptic hair cell Ca2+profiles of a single neuromast in response to a 2-s 5 Hz (anterior-posterior directed square wave) stimulus that activates all hair cells before (l) and after 5 μM Bay K treatment (m). Spatial patterns of Ca2+ signals during stimulation are colorized according to the ΔF/F heat maps and superimposed onto the prestimulus baseline image (k). (n-o) After Bay K application, apical Ca2+ signals (naïve: 77.19 % ± 5.98; after Bay K: 76.01 ± 6.40, n = 94 cells, p = 0.51) show no significant difference, while presynaptic Ca2+ signals (naïve: 34.02 % ± 4.76; after bayK: 41.12 % ± 5.26, n = 94 cells, p = 0.0001) show significant increases. A Wilcoxon test was used in (d-e), (i-j), and (n-o), ***p < 0.001. ****p < 0.0001. Scale bars = 5 μm. |