
Fig. 2
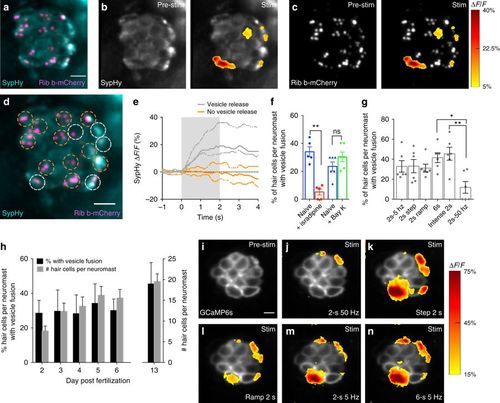
Presynaptic vesicle fusion occurs in a subset of hair cells. a Neuromast hair cells expressing SypHy (vesicle fusion, cyan) and Ribeye b-mCherry (ribbons, magenta). b, c Spatial patterns of SypHy signals during a 2-s 5 Hz stimulation (right panels) are colorized according to the ∆F/F heat map and superimposed onto a baseline SypHy image (b, left panel) or onto an image of ribbons (c, left panel). Only a subset of the hair cells display vesicle fusion. d Dashed circles indicate ROIs (3 µm diameter) used to detect SypHy signals from example in a–c. e Plot of SypHy signals (mean with upper and lower limits) from cells in d from five cells with (white) and eight cells without (orange) vesicle fusion. f The % of hair cells per neuromast with vesicle fusion (naïve blue, 34.04% ± 3.55, n = 5 neuromasts) decreases after 10 µM isradipine treatment (red, 5.20% ± 2.16, p = 0.007), but is not altered (naïve blue, 23.50% ± 3.20, n = 6 neuromasts) after 10 µM Bay K treatment (green, 30.33% ± 3.48, p = 0.10). g The % of hair cells per neuromast with vesicle fusion in response to different stimuli, n = 6 neuromasts per stimulus. h The % of hair cells per neuromast with vesicle fusion does not vary during development despite the increase in hair-cell number, n = 6 neuromasts per age. The % of cells with a SypHy response at day 2 (28.57% ± 3.01) is not different from day 13 (45.47% ± 5.46), p = 0.11. i–n The same subset of hair cells has robust presynaptic Ca2+ signals in response to a variety of stimuli, n = 5 neuromasts. Similar to g, in j, fewer active cells are observed in response to a 2-s 50 Hz stimulus. A paired t-test was used for comparisons in f. A one-way ANOVA, df = 30 or 2-way ANOVA, df = 25, with post-hoc Tukey’s test to correct for multiple comparisons were used in g and h, respectively; *p < 0.05, **p < 0.01. Scale bars = 5 μm |