
|
Fig. 6
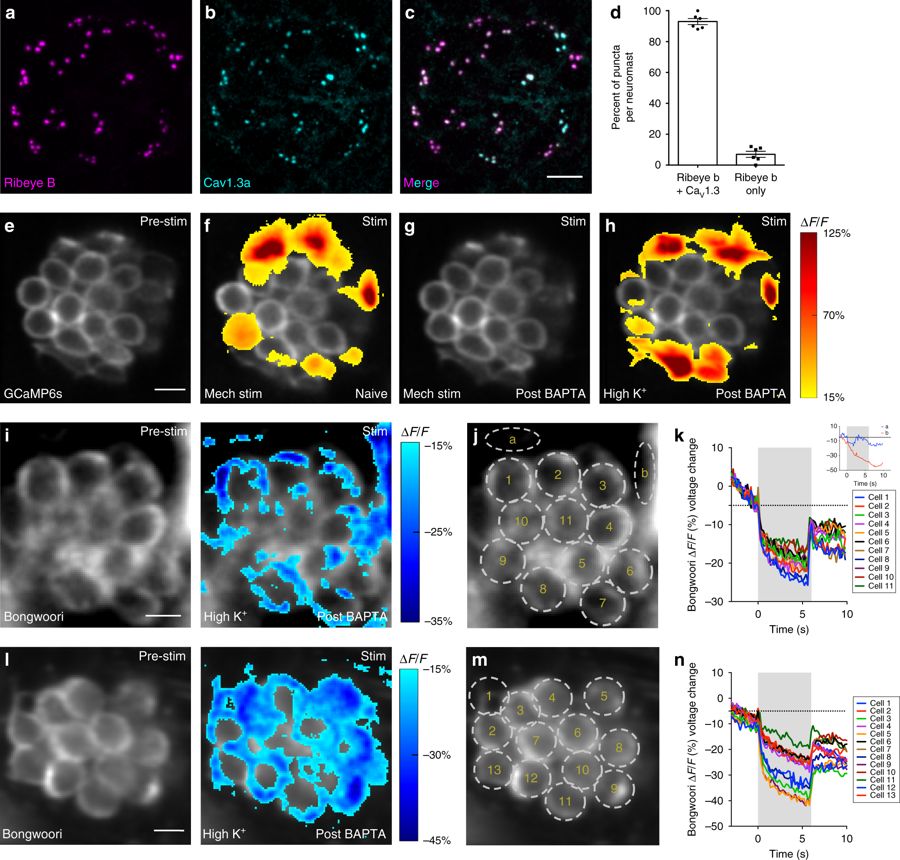
Depolarization does not activate CaV1.3 channels in all cells. a–c Example neuromast with immunostain labeling presynaptic ribbons (Ribeye b, magenta) in a, and presynaptic CaV1.3a channels (cyan) in b. Images in a and b are merged in c. d Quantification of the percent of Ribeye b positive ribbons per neuromast that colocalize with CaV1.3a (93.00% ± 1.93, n = 10 neuromasts). e–h Representative neuromast demonstrating spatial patterns of hair-cell presynaptic GCaMP6s Ca2+ signals during mechanical and high K+ stimulation. Signals are colorized according to the ∆F/F heat map and superimposed onto baseline GCaMP6s image (e). f A subset of cells shows presynaptic Ca2+ signals in response to a 2-s 5 Hz mechanical stimulus. g All mechanical responses are eliminated after BAPTA treatment. h After BAPTA treatment, to depolarize hair cells, high K+ was applied (via the fluid jet). High K+ application activates the same cells as the original mechanical stimulus (f). i, l Example neuromasts demonstrating spatial patterns of hair-cell Bongwoori voltage signals during high K+ stimulation. Spatial patterns of Bongwoori voltage signals during high K+ stimulation are colorized according to the ∆F/F heat map and superimposed onto baseline Bongwoori image (i, l, left panels). k, n Using 5 µm ROIs shown in j, m, all cells show depolarization in response to high K+ application. Inset in k demonstrates that changes in Bongwoori signals in the background skin pigment (ROIs a, b) do no correlate with the stimulus. Scale bars = 5 μm