
|
Fig. S3
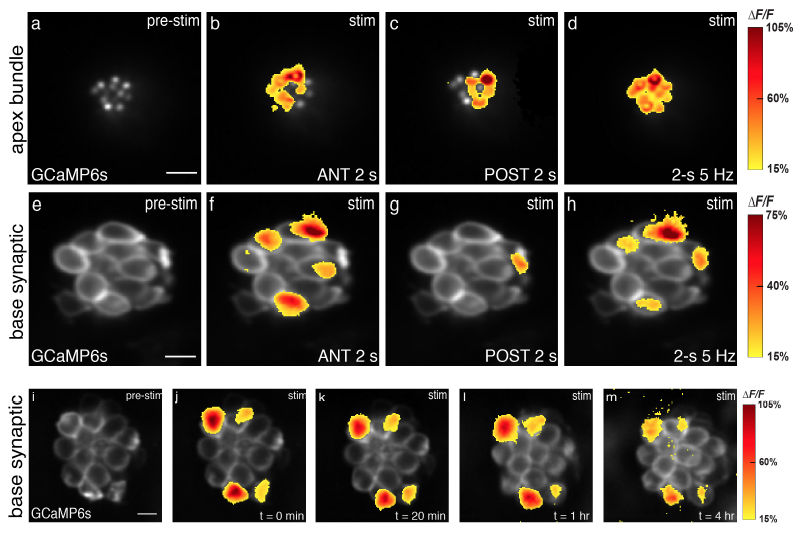
Two main stimulus types used in experiments; presynaptic responses are stable over time. (a-d) Apical Ca2+ profiles in response to 2 s anterior stimulus (b), 2 s posterior stimulus (c) and 2-s 5 Hz frequency stimulus (d). (e-h) Preynaptic Ca2+ profiles from the same hair cells in (a-d), in response to 2 s anterior stimulus (f), 2 s posterior stimulus (g) and 2-s 5 Hz frequency stimulus (h). Spatial patterns of Ca2+ signals during stimulation are colorized according to the ΔF/F heat maps and superimposed onto pre-stimulus baseline images (a, e). (im) The same subset of cells had robust presynaptic Ca2+ influx over multiple trials with same stimulation after 20 min (k), 1 hr (l), and 4 hrs (m), n = 6 neuromasts. Spatial patterns of Ca2+ signals during stimulation are colorized according to the ΔF/F heat maps and superimposed onto pre-stimulus baseline image at each time point (ie: i for t = 0 min). Scale bars = 5 μm.