FIGURE SUMMARY
Title

RAB13 mRNA compartmentalisation spatially orients tissue morphogenesis

Authors
Costa, G., Bradbury, J.J., Tarannum, N., Herbert, S.P.
Source
Full text @ EMBO J.

The 3′UTR of <italic>rab13</italic> targets mRNA to endothelial cell protrusions <italic>in vivo</italic>

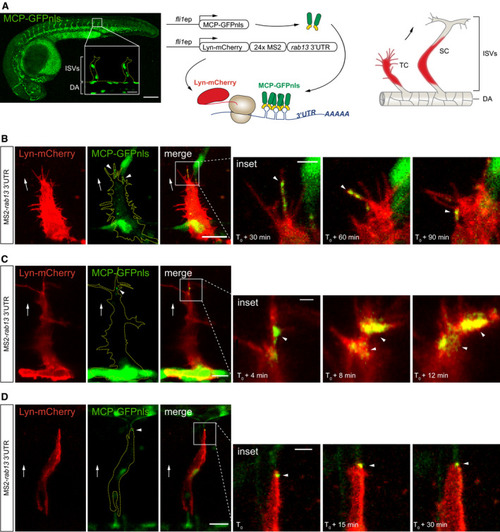
Left: Tg(fli1ep:MCP‐GFPnls) zebrafish embryo at 26 h post‐fertilisation (hpf) displaying vascular‐specific expression of MCP‐GFPnls. Inset shows the nuclear expression of MCP‐GFPnls in the intersomitic vessels (ISVs) sprouting from the dorsal aorta (DA). Middle: scheme depicts the in vivo MS2 system strategy with fli1 enhancer/promoter (fli1ep)‐driven expression of reporter constructs, simultaneous translation of Lyn‐mCherry reporter and binding of MCP‐GFPnls to 24xMS2‐rab13 3′UTR. Right: scheme illustrates ISV cells expressing Lyn‐mCherry imaged in panels B–D. TC: tip cell; SC: stalk cell.

Time‐lapse microscopy of Tg(fli1ep:MCP‐GFPnls) tip and stalk cells displaying mosaic expression of Lyn‐mCherry‐24xMS2‐rab13 3′UTR in ISV cells.

Data information: T0 = 24 hpf (C), 28 hpf (B), 48 hpf (D). Arrowheads indicate non‐nuclear localisation of MCP‐GFPnls; arrows indicate direction of ISV sprouting; yellow dashed lines outline ISV (A) or ISV cell (B‐D) borders; scale bars = 200 μm (A), 20 μm (B, D) and 10 μm (C); scale bars in insets = 20 μm (A), 5 μm (B, D) and 2 μm (C).

ZFIN is incorporating published figure images and captions as part of an ongoing project. Figures from some publications have not yet been curated, or are not available for display because of copyright restrictions.

EXPRESSION / LABELING:
Gene:
Fish:
Anatomical Terms:
Stage: Prim-5

Clustering of RNAseq datasets identifies mRNAs exhibiting universal targeting to protrusions in diverse cell types

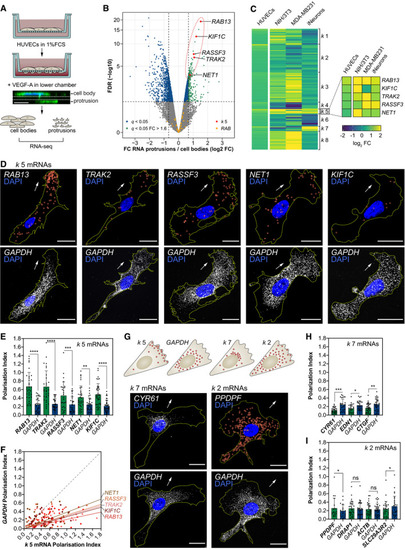
Strategy used to screen for mRNAs enriched in motile protrusions of HUVECs migrating through Transwell membranes.

RNAseq data are plotted in log2 fold change (FC) levels of protrusions over cell bodies against adjusted −log10 false discovery rate (FDR) (= 2 replicates, average FC values are represented). The horizontal dashed line marks the FDR (q) = 0.05 threshold; vertical dashed lines mark the FC = 0.625 (left) or FC = 1.6 (right) thresholds.

Heat map represents the k‐means clustering of transcript log2 FC levels (protrusions over cell bodies) extracted from RNAseq datasets published elsewhere. The corresponding HUVEC FC levels are shown in parallel.

smFISH co‐detection of k 5 mRNAs and GAPDH in subconfluent motile HUVECs.

Polarisation Index (PI) of k 5 mRNAs and GAPDH in co‐detected in HUVECs ( 28 cells; **< 0.01, ***P < 0.001, ****< 0.0001; Wilcoxon test).

k 5 mRNA PIs plotted against respective GAPDH PIs. The slope of the coloured lines represents the average k 5 mRNA/GAPDH PI ratio; the dashed grey line represents a 1:1 ratio ( 28 cells).

Top: distribution pattern of mRNAs clustered in k 2, k 5, k 7 and GAPDH. Bottom: smFISH co‐detection of exemplar k 7/k 2 mRNAs and GAPDH in subconfluent motile HUVECs.

PIs of k 7 mRNAs and GAPDH co‐detected in HUVECs ( 25 cells; *< 0.05, **< 0.01, ***P < 0.001; paired t test).

PIs of k 2 mRNAs and GAPDH co‐detected in HUVECs ( 19 cells; *< 0.05; Wilcoxon test).

Data information: arrows indicate orientation of RNA localisation; yellow dashed lines outline cell borders; red circles highlight smFISH spots; scale bars = 20 μm (D, G). Bar charts are presented as means ± s.d.

Clustering of RNAseq datasets defines an RNA motif enriched in 3′UTR sequences that target <italic>k</italic> 5 mRNAs to protrusions

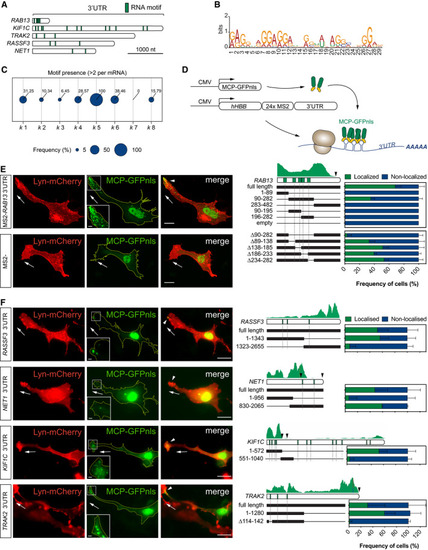
Diagram of k 5 mRNA 3′UTRs and relative positions of the RNA motif shared between transcripts.

RNA motif over‐represented in k 5 mRNA 3′UTRs.

Frequency of mRNAs within each k‐means cluster containing at least 2 of the RNA motif over‐represented in k 5 mRNAs.

Scheme depicts the in vitro MS2 system strategy. CMV promoter‐driven expression of MCP‐GFPnls and hHBB‐24xMS2‐tagged RAB13 3′UTR. The visualisation of MCP‐GFPnls bound to 24xMS2 allows the identification of the minimal region in the 3′UTR of RAB13 necessary for its localisation.

Left: representative subconfluent motile cells co‐transfected with plasmids expressing Lyn‐mCherry, MCP‐GFPnls and 24xMS2‐RAB13 3′UTR or 24xMS2. Right: percentage of cells with MCP‐GFPnls localised to protrusions when co‐transfected with full length or deletion versions of RAB13 3′UTR ( 3 experiments).

Left: representative cells co‐transfected with plasmids expressing Lyn‐mCherry, MCP‐GFPnls and 24xMS2‐k 5 3′UTRs. Right: percentage of cells with MCP‐GFPnls localised to protrusions when co‐transfected with full length or deletion versions of k 5 3′UTR ( 3 experiments).

Data information: white arrowheads indicate non‐nuclear localisation of MCP‐GFPnls; arrows indicate the orientation of RNA localisation; yellow dashed lines outline cell borders; scale bars = 20 μm (E, F); scale bars in insets = 5 μm (E) and 2 μm (F). For each k 5 mRNA 3′UTR, a diagram of the full‐length 3′UTR and the positions of the RNA motif is shown together with the respective RNAseq mapped reads from HUVEC protrusions; black arrowheads indicate predicted polyadenylation sites (E, F). Bar charts are presented as means ± s.d.

CRISPR‐Cas9 excision of the 3′UTR localisation element of <italic>RAB13</italic> disrupts mRNA targeting

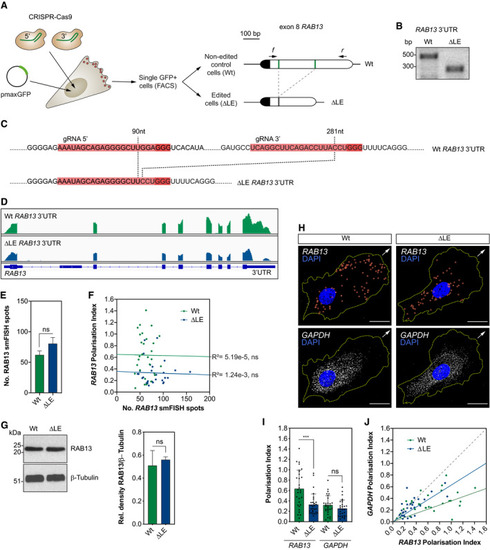
CRISPR‐Cas9 strategy to derive HUVECs with an excision of the LE in the RAB13 3′UTR (∆LE) and parallel generation of wild‐type (Wt) control cells. The Wt RAB13 exon 8 is represented with its coding sequence in dark and the 3′UTR in clear boxes. The 5′ and 3′ gRNA‐targeted regions are represented with green lines. Arrows: relative positions of the forward (f) and reverse (r) PCR primers used to identify HUVECs with CRISPR‐Cas9-mediated excision of the LE.

Representative genotyping PCR demonstrates the band size shift in ∆LE HUVECs.

Detailed DNA sequence depicting nucleotide positions within the RAB13 3′UTR of Wt and ∆LE HUVECs.

Wt and ∆LE HUVEC RNAseq mapped reads depicting RAB13 exon usage.

Quantification of RAB13 mRNA smFISH spot number in Wt and ∆LE HUVECs (= 3 experiments; ns: not significant; unpaired t test).

Number of RAB13 mRNA smFISH spots plotted against the respective Polarisation Index (PI) (= 29 cells; ns: not significant; linear regression).

Left: representative Western blotting (WB) of Wt and ∆LE HUVECs. Right: densitometry analysis of WB data (= 3 samples; ns: not significant; unpaired t test).

smFISH co‐detection of RAB13 and control GAPDH in Wt and ∆LE motile HUVECs cultured under subconfluent conditions.

PI of RAB13 and GAPDH co‐detected in Wt and ∆LE HUVECs (= 29 cells; ***< 0.001, ns: not significant; Mann–Whitney test).

RAB13 PI plotted against respective GAPDH PI. The slope of the coloured lines represents the average RAB13/GAPDH PI ratio; the dashed grey line represents a 1:1 ratio (= 29 cells).

Data information: 3 Wt and 3 ∆LE HUVECs independent clones were used to collect data (E–J). Arrows indicate orientation of RNA localisation; yellow dashed lines outline cell borders; red circles highlight smFISH spots; scale bars = 20 μm (H). Bar charts are presented as means ± s.d.Source data are available online for this figure.

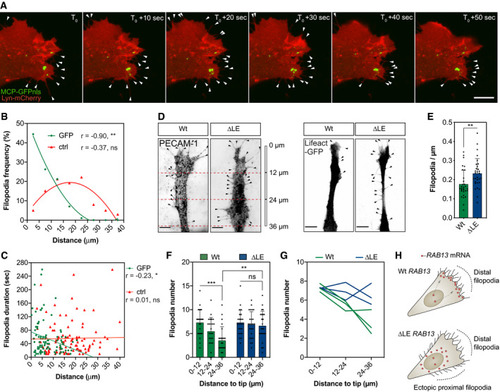
<italic>RAB13</italic> mRNA polarisation spatially orients filopodia dynamics

Representative time‐lapse microscopy of a bEnd.3 cell co‐transfected with plasmids expressing Lyn‐mCherry, MCP‐GFPnls and 24xMS2‐RAB13 3′UTR.

Frequency of newly formed filopodia formed within 5‐μm intervals relative to the nearest MCP‐GFPnls particle or a randomised (ctrl) position (= 99 filopodia; **< 0.01, ns: not significant; Pearson's r correlation).

Distance of newly formed filopodia to MCP‐GFPnls or a ctrl position plotted against filopodia duration (= 99 filopodia; *< 0.05, ns: not significant; Spearman's r correlation).

Wt and ∆LE HUVECs co‐cultured on fibroblast monolayers. Endothelial cells were identified either with an antibody against the endothelial cell marker PECAM‐1 (left) or through expression of a nucleofected plasmid encoding the cytoskeletal marker Lifeact‐GFP (right).

Number of filopodia detected in co‐cultured HUVECs (= 30 cells; **< 0.01; unpaired t test).

Number of filopodia detected in co‐cultured HUVECs within 12‐μm intervals relative to cell distal tip (= 30 cells; **< 0.01, ***< 0.001, ns: not significant; one‐way ANOVA with Bonferroni's correction).

Number of filopodia detected in individual clones of co‐cultured HUVECs within 12‐μm intervals relative to cell distal tip.

Illustration of the spatial relationship between RAB13 mRNA localisation and sites of filopodia production.

Data information: 3 Wt and 3 ∆LE HUVECs independent clones were used to collect data (D–G). Arrowheads indicate filopodia (A, D); scale bars = 10 μm (A) and 6 μm (D). Bar charts are presented as means ± s.d.

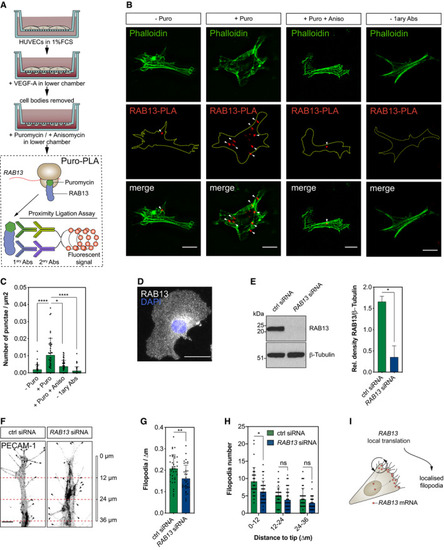
mRNA polarisation achieves spatial compartmentalisation of RAB13 translation and protein function

Strategy used to detect local protein synthesis in protrusions formed by HUVECs migrating through Transwell membranes.

Representative Puro‐PLA experiments detecting newly synthesised RAB13 in HUVEC protrusions present in the lower side of Transwell membranes. Puro: puromycin; Aniso: anisomycin; 1ary Abs: primary antibodies.

Quantification of RAB13 Puro‐PLA punctae normalised to protrusion area ( 40 protrusions; *< 0.05, ****< 0.0001; Kruskal–Wallis test with Dunn's correction).

Representative RAB13 IF assay on migrating HUVECs.

Left: representative Western blotting (WB) of siRNA‐transfected HUVECs. Right: densitometry analysis of WB data (= 3 samples; *< 0.05; paired t test).

Control (ctrl) and RAB13 siRNA‐treated HUVECs co‐cultured on fibroblast monolayers. Endothelial cells were identified with an antibody against the endothelial cell marker PECAM‐1.

Number of filopodia detected in co‐cultured HUVECs ( 35 cells; **< 0.01; unpaired t test).

Number of filopodia detected in co‐cultured HUVECs within 12‐μm intervals relative to cell distal tip ( 35 cells; *< 0.05, ns: not significant; Kruskal–Wallis test with Dunn's correction).

Illustration of the spatial relationship between the sites of RAB13 mRNA localisation, local translation and RAB13 protein‐mediated filopodia distribution.

Data information: white arrowheads indicate Puro‐PLA punctate; yellow dashed lines outline protrusion borders (B); black arrowheads indicate filopodia (F); scale bars = 10 μm (B, D) and 6 μm (F). Bar charts are presented as means ± s.d.Source data are available online for this figure.

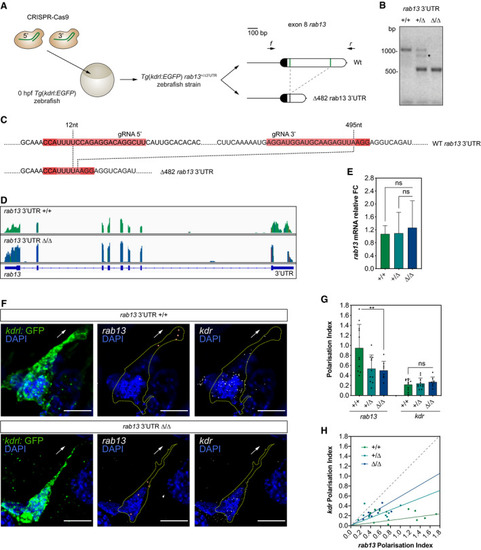
CRISPR‐Cas9 editing of the zebrafish <italic>rab13</italic> 3′UTR perturbs mRNA polarisation

CRISPR‐Cas9 strategy to generate the Tg(kdrl:EGFP) rab13+/∆3′UTR zebrafish strain. The wild‐type (Wt) rab13 exon 8 is represented with its coding sequence in dark and the 3′UTR in clear boxes; the 5′ and 3′ gRNA‐targeted regions are represented with green lines. Arrows: relative positions of the forward (f) and reverse (r) PCR primers used to identify animals with CRISPR‐Cas9-mediated deletions (∆) in the rab13 3′UTR.

Representative genotyping PCR demonstrates the band size shift in zebrafish harbouring a ∆482 rab13 3′UTR. Asterisk marks a heteroduplex formed between Wt and 482 rab13 3′UTR PCR amplicons.

Detailed DNA sequence depicting nucleotide positions within the Wt and ∆482 rab13 3′UTR.

RNAseq mapped reads depicting rab13 exon usage in Tg(kdrl:EGFP) rab13+/+ and rab13∆3′UTR/∆3′UTR zebrafish embryos. Coloured lines indicate SNPs.

qPCR analysis of rab13 mRNA levels in individual 26–28 hpf clutch‐matched sibling embryos ( 9 embryos; ns: not significant; Kruskal–Wallis test with Dunn's correction).

smFISH detection of rab13 and kdr mRNA in cultured GFP‐expressing endothelial cells extracted from 48 hpf Tg(kdrl:EGFP) rab13+/+ and rab13∆3′UTR/∆3′UTR zebrafish embryos.

Polarisation Index (PI) of rab13 and kdr detected by smFISH in individual zebrafish cells ( 8 cells; **< 0.01, ns: not significant; one‐way ANOVA with Bonferroni's correction).

rab13 PI plotted against respective kdr PI. The slope of the coloured lines represents the average rab13/kdr PI ratio; the dashed grey line represents a 1:1 ratio ( 8 cells).

Data information: +/+, +/∆ and ∆/∆ represent Tg(kdrl:EGFP) rab13+/+, rab13+/∆3′UTR and rab13∆3′UTR/∆3′UTR embryos, respectively (E, G, H). Arrows indicate orientation of RNA localisation; yellow dashed lines outline cell borders; red circles highlight smFISH spots; scale bars = 10 μm (F). Bar charts are presented as means ± s.d.

EXPRESSION / LABELING:
Gene:
Fish:
Anatomical Term:
Stage: Prim-5

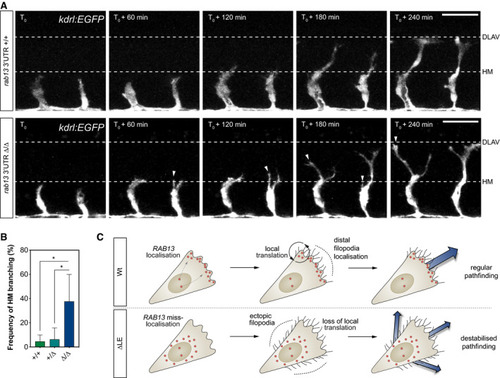
<italic>rab13</italic> mRNA polarisation orients blood vessel morphogenesis

Time‐lapse confocal microscopy of representative Tg(kdrl:EGFP) rab13+/+ and rab13∆3′UTR/∆3′UTR embryos. DLAV: dorsal longitudinal anastomotic vessel; HM: horizontal myoseptum.

Frequency of ISV ectopic branching occurring at the HM (= 4 experiments; *< 0.05; one‐way ANOVA with Bonferroni's correction).

Illustration of the role for RAB13 mRNA localisation, local translation and compartmentalisation of RAB13 function in defining the orientation of EC filopodia dynamics, motile EC polarity and blood vessel pathfinding.

Data information: T0 = 25 hpf; arrowheads indicate extra branches emerging from the main ISVs at the HM position; scale bars = 50 μm (A). +/+, +/∆ and ∆/∆ represent Tg(kdrl:EGFP) rab13+/+, rab13+/∆3′UTR and rab13∆3′UTR/∆3′UTR embryos, respectively (B). Bar chart is presented as means ± s.d.

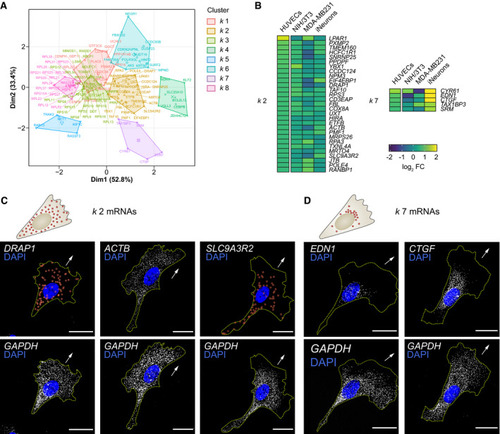
Clustering of <styled-content toggle='no' style='fixed-case'>RNA</styled-content>seq datasets defines unexpected cell type‐specific diversity to <styled-content toggle='no' style='fixed-case'>mRNA</styled-content> polarisation

Principal component plot depicting the k‐means clustering analysis of mRNAs enriched across cell protrusion types.

Detail of the heat map shown in Fig 1C representing log2 fold change (FC) levels (protrusions over cell bodies) of mRNAs present in clusters k 2 and k 7. The corresponding HUVEC log2 FC levels are shown in parallel.

Top: distribution pattern of mRNAs clustered in k 2. Bottom: smFISH co‐detection of k 2 mRNAs and GAPDH in HUVECs.

Top: distribution pattern of mRNAs clustered in k 7. Bottom: smFISH co‐detection of k 7 mRNAs and GAPDH in HUVECs.

Data information: arrows indicate the orientation of RNA localisation; yellow dashed lines outline cell borders; red circles highlight smFISH spots; scale bars = 20 μm (C, D).

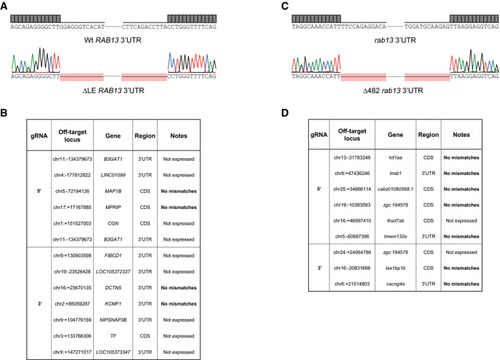
<styled-content toggle='no' style='fixed-case'>CRISPR</styled-content>‐Cas9 editing of the <italic><styled-content toggle='no' style='fixed-case'>RAB</styled-content></italic> 3′<styled-content toggle='no' style='fixed-case'>UTR</styled-content><italic>in vitro and in vivo</italic> does not generate off‐target mutations

Chromatogram confirming the excision of the LE within RAB13 3′UTR in HUVECs.

List of predicted CRISPR‐Cas9 off‐target genes and RNAseq mismatch detection in CRISPR‐Cas9-derived HUVEC clones (= 1 each genotype).

Chromatogram confirming the CRISPR‐Cas9-mediated excision of 482‐nt within the rab13 3′UTR in zebrafish embryos.

List of predicted CRISPR‐Cas9 off‐target genes and RNAseq mismatch detection in Tg(kdrl:EGFP) rab13+/+ and rab13∆3′UTR/∆3′UTR embryos (= 2 each genotype).

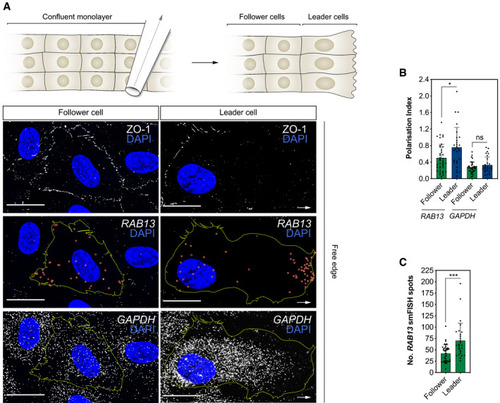
Induction of endothelial cell collective migration drives <italic><styled-content toggle='no' style='fixed-case'>RAB</styled-content>13</italic><styled-content toggle='no' style='fixed-case'>mRNA</styled-content> polarisation in leader cells

Top: scratch wound assay generates a free edge on a confluent monolayer of HUVECs and encourages cell migration. Bottom: smFISH co‐detection of RAB13 mRNA and GAPDH mRNA in representative HUVECs migrating in a scratch wound assay. ZO‐1 immunolabelling defines cell boundaries.

Polarisation Index of RAB13 and GAPDH co‐detected in HUVECs cultured in scratch wound assays ( 28 cells; *< 0.05, ns: not significant; Mann–Whitney test).

Quantification of the number of RAB13 mRNA smFISH spots per cell ( 28 cells; ***P < 0.001; Mann–Whitney test). Leader: cells identified at the edge of the scratch; follower: cells identified in confluent regions adjacent to leader cells.

Data information: arrows indicate orientation of RNA localisation; yellow dashed lines outline cell borders; red circles highlight smFISH spots; scale bars = 20 μm (A). Bar charts are presented as means ± s.d.

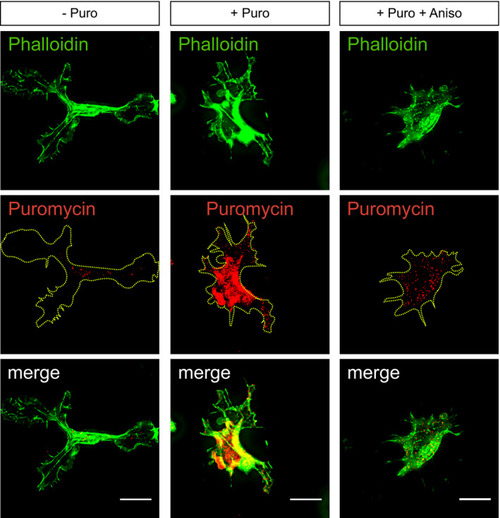
Protein translation in endothelial cell protrusions

Immunofluorescence analysis of HUVEC protrusions generated on the underside of Transwell membranes and exposed to puromycin after cell body removal. Yellow dashed lines outline protrusion borders; scale bars = 10 μm.

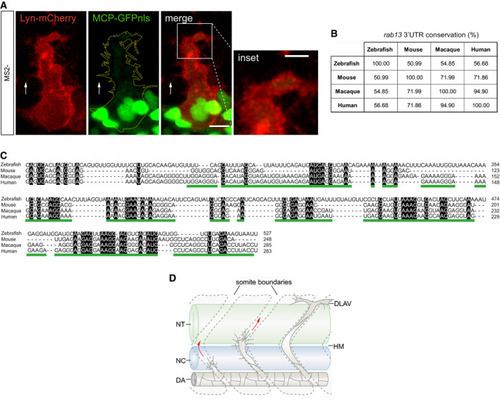
The 3′<styled-content toggle='no' style='fixed-case'>UTR</styled-content> of <italic>rab13</italic> shows low conservation across species whilst retaining <styled-content toggle='no' style='fixed-case'>mRNA</styled-content> localisation potential

Tg(fli1ep:MCP‐GFPnls) tip cell expressing a control Lyn‐mCherry‐24xMS2 construct.

Percentage identity matrix of rab13 3′UTR orthologue sequences.

Multiple sequence alignment between rab13 3′UTR orthologues. Black boxes indicate absolute nucleotide similarity. The human RAB13 3′UTR localisation element is underlined in green.

Scheme depicts stages of zebrafish ISV sprouting. DA: dorsal aorta; DLAV: dorsal longitudinal anastomotic vessel; HM: horizontal myoseptum; NC: notochord; NT: neural tube.

Data information: white arrows indicate direction of ISV sprouting; yellow dashed line outlines ISV cell borders; scale bars = 10 μm; scale bar in inset = 5 μm (A).

Acknowledgments
This image is the copyrighted work of the attributed author or publisher, and ZFIN has permission only to display this image to its users. Additional permissions should be obtained from the applicable author or publisher of the image. Full text @ EMBO J.