
|
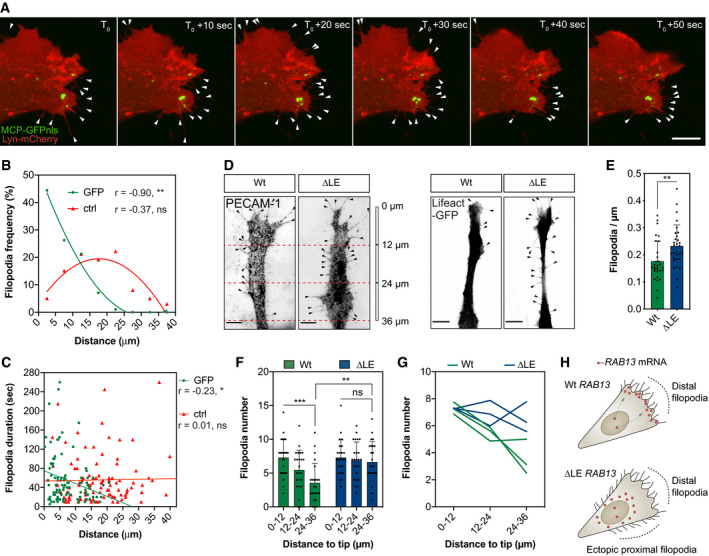
Figure 4
Representative time‐lapse microscopy of a bEnd.3 cell co‐transfected with plasmids expressing Lyn‐mCherry, MCP‐GFPnls and 24xMS2‐ Frequency of newly formed filopodia formed within 5‐μm intervals relative to the nearest MCP‐GFPnls particle or a randomised (ctrl) position ( Distance of newly formed filopodia to MCP‐GFPnls or a ctrl position plotted against filopodia duration ( Wt and ∆LE HUVECs co‐cultured on fibroblast monolayers. Endothelial cells were identified either with an antibody against the endothelial cell marker PECAM‐1 (left) or through expression of a nucleofected plasmid encoding the cytoskeletal marker Lifeact‐GFP (right). Number of filopodia detected in co‐cultured HUVECs ( Number of filopodia detected in co‐cultured HUVECs within 12‐μm intervals relative to cell distal tip ( Number of filopodia detected in individual clones of co‐cultured HUVECs within 12‐μm intervals relative to cell distal tip. Illustration of the spatial relationship between
Data information: 3 Wt and 3 ∆LE HUVECs independent clones were used to collect data (D–G). Arrowheads indicate filopodia (A, D); scale bars = 10 μm (A) and 6 μm (D). Bar charts are presented as means ± s.d.