
|
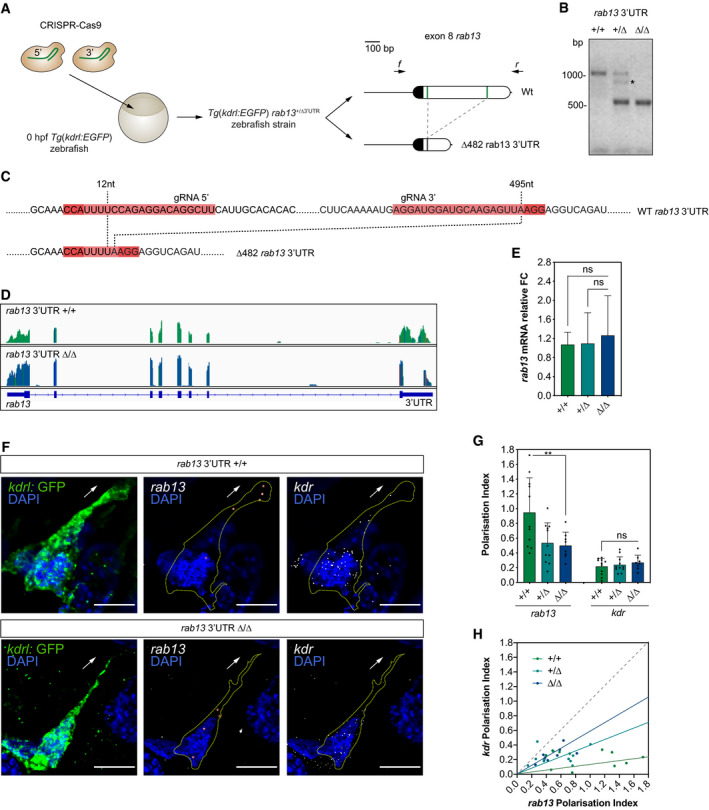
Figure 7
CRISPR‐Cas9 strategy to generate the Representative genotyping PCR demonstrates the band size shift in zebrafish harbouring a ∆482 Detailed DNA sequence depicting nucleotide positions within the Wt and ∆482 RNAseq mapped reads depicting qPCR analysis of smFISH detection of Polarisation Index (PI) of
Data information: +/+, +/∆ and ∆/∆ represent