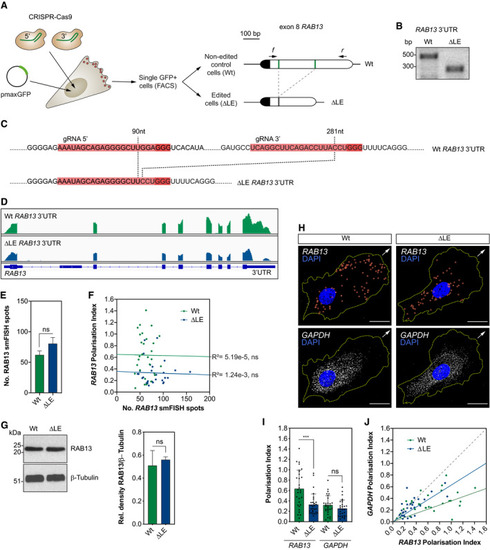
CRISPR‐Cas9 strategy to derive HUVECs with an excision of the LE in the RAB13 3′UTR (∆LE) and parallel generation of wild‐type (Wt) control cells. The Wt RAB13 exon 8 is represented with its coding sequence in dark and the 3′UTR in clear boxes. The 5′ and 3′ gRNA‐targeted regions are represented with green lines. Arrows: relative positions of the forward (f) and reverse (r) PCR primers used to identify HUVECs with CRISPR‐Cas9-mediated excision of the LE.
Representative genotyping PCR demonstrates the band size shift in ∆LE HUVECs.
Detailed DNA sequence depicting nucleotide positions within the RAB13 3′UTR of Wt and ∆LE HUVECs.
Wt and ∆LE HUVEC RNAseq mapped reads depicting RAB13 exon usage.
Quantification of RAB13 mRNA smFISH spot number in Wt and ∆LE HUVECs (n = 3 experiments; ns: not significant; unpaired t test).
Number of RAB13 mRNA smFISH spots plotted against the respective Polarisation Index (PI) (n = 29 cells; ns: not significant; linear regression).
Left: representative Western blotting (WB) of Wt and ∆LE HUVECs. Right: densitometry analysis of WB data (n = 3 samples; ns: not significant; unpaired t test).
smFISH co‐detection of RAB13 and control GAPDH in Wt and ∆LE motile HUVECs cultured under subconfluent conditions.
PI of RAB13 and GAPDH co‐detected in Wt and ∆LE HUVECs (n = 29 cells; ***P < 0.001, ns: not significant; Mann–Whitney test).
RAB13 PI plotted against respective GAPDH PI. The slope of the coloured lines represents the average RAB13/GAPDH PI ratio; the dashed grey line represents a 1:1 ratio (n = 29 cells).
Data information: 3 Wt and 3 ∆LE HUVECs independent clones were used to collect data (E–J). Arrows indicate orientation of RNA localisation; yellow dashed lines outline cell borders; red circles highlight smFISH spots; scale bars = 20 μm (H). Bar charts are presented as means ± s.d.