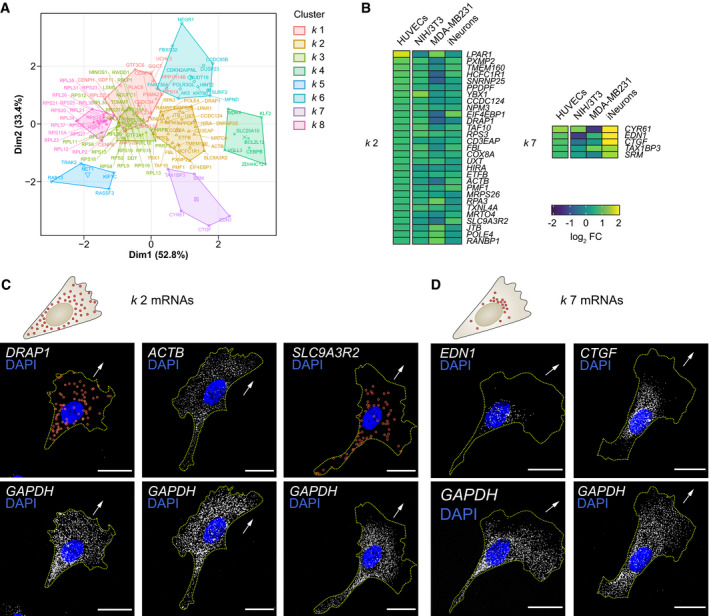
IMAGE

Figure EV1

ID
ZDB-IMAGE-201107-15
Source
Figures for Costa et al., 2020
Image
Figure Caption

Figure EV1 Clustering of <styled-content toggle='no' style='fixed-case'>RNA</styled-content>seq datasets defines unexpected cell type‐specific diversity to <styled-content toggle='no' style='fixed-case'>mRNA</styled-content> polarisation

Principal component plot depicting the k‐means clustering analysis of mRNAs enriched across cell protrusion types.

Detail of the heat map shown in Fig 1C representing log2 fold change (FC) levels (protrusions over cell bodies) of mRNAs present in clusters k 2 and k 7. The corresponding HUVEC log2 FC levels are shown in parallel.

Top: distribution pattern of mRNAs clustered in k 2. Bottom: smFISH co‐detection of k 2 mRNAs and GAPDH in HUVECs.

Top: distribution pattern of mRNAs clustered in k 7. Bottom: smFISH co‐detection of k 7 mRNAs and GAPDH in HUVECs.

Data information: arrows indicate the orientation of RNA localisation; yellow dashed lines outline cell borders; red circles highlight smFISH spots; scale bars = 20 μm (C, D).

Acknowledgments
This image is the copyrighted work of the attributed author or publisher, and ZFIN has permission only to display this image to its users. Additional permissions should be obtained from the applicable author or publisher of the image. Full text @ EMBO J.