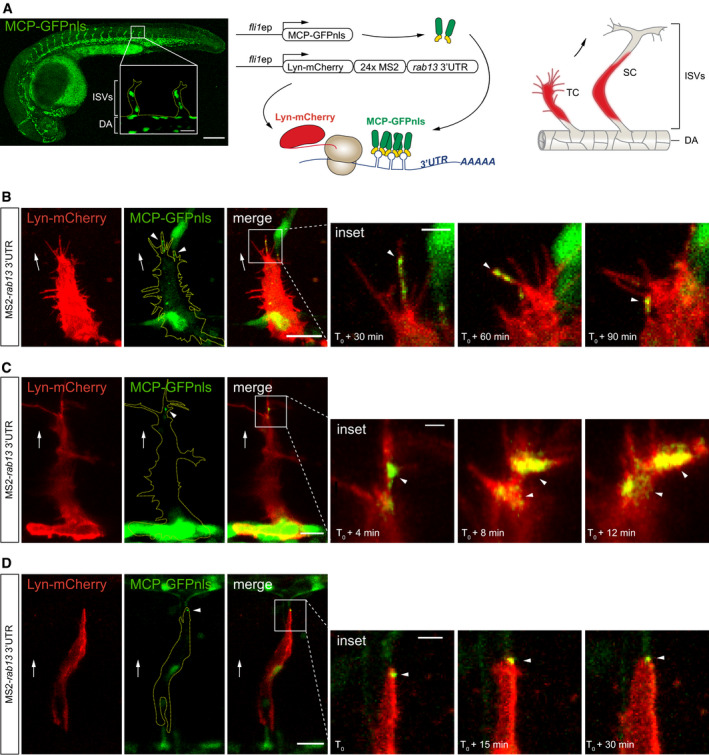
IMAGE

B–D

ID
ZDB-IMAGE-201107-24
Source
Figures for Costa et al., 2020
Image
Figure Caption

B–D The 3′UTR of <italic>rab13</italic> targets mRNA to endothelial cell protrusions <italic>in vivo</italic>

Left: Tg(fli1ep:MCP‐GFPnls) zebrafish embryo at 26 h post‐fertilisation (hpf) displaying vascular‐specific expression of MCP‐GFPnls. Inset shows the nuclear expression of MCP‐GFPnls in the intersomitic vessels (ISVs) sprouting from the dorsal aorta (DA). Middle: scheme depicts the in vivo MS2 system strategy with fli1 enhancer/promoter (fli1ep)‐driven expression of reporter constructs, simultaneous translation of Lyn‐mCherry reporter and binding of MCP‐GFPnls to 24xMS2‐rab13 3′UTR. Right: scheme illustrates ISV cells expressing Lyn‐mCherry imaged in panels B–D. TC: tip cell; SC: stalk cell.

Time‐lapse microscopy of Tg(fli1ep:MCP‐GFPnls) tip and stalk cells displaying mosaic expression of Lyn‐mCherry‐24xMS2‐rab13 3′UTR in ISV cells.

Data information: T0 = 24 hpf (C), 28 hpf (B), 48 hpf (D). Arrowheads indicate non‐nuclear localisation of MCP‐GFPnls; arrows indicate direction of ISV sprouting; yellow dashed lines outline ISV (A) or ISV cell (B‐D) borders; scale bars = 200 μm (A), 20 μm (B, D) and 10 μm (C); scale bars in insets = 20 μm (A), 5 μm (B, D) and 2 μm (C).

Acknowledgments
This image is the copyrighted work of the attributed author or publisher, and ZFIN has permission only to display this image to its users. Additional permissions should be obtained from the applicable author or publisher of the image. Full text @ EMBO J.