IMAGE

Figure EV3

ID
ZDB-IMAGE-201107-22
Source
Figures for Costa et al., 2020
Image
Figure Caption

Figure EV3 Induction of endothelial cell collective migration drives <italic><styled-content toggle='no' style='fixed-case'>RAB</styled-content>13</italic><styled-content toggle='no' style='fixed-case'>mRNA</styled-content> polarisation in leader cells

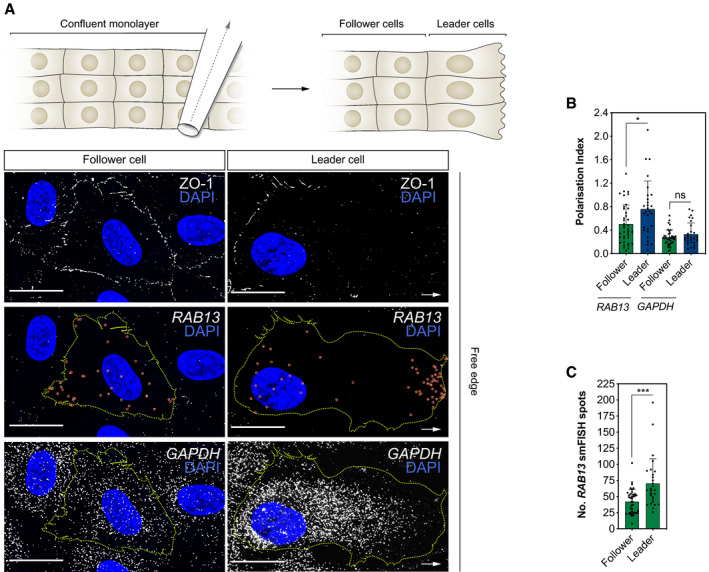
Top: scratch wound assay generates a free edge on a confluent monolayer of HUVECs and encourages cell migration. Bottom: smFISH co‐detection of RAB13 mRNA and GAPDH mRNA in representative HUVECs migrating in a scratch wound assay. ZO‐1 immunolabelling defines cell boundaries.

Polarisation Index of RAB13 and GAPDH co‐detected in HUVECs cultured in scratch wound assays ( 28 cells; *< 0.05, ns: not significant; Mann–Whitney test).

Quantification of the number of RAB13 mRNA smFISH spots per cell ( 28 cells; ***P < 0.001; Mann–Whitney test). Leader: cells identified at the edge of the scratch; follower: cells identified in confluent regions adjacent to leader cells.

Data information: arrows indicate orientation of RNA localisation; yellow dashed lines outline cell borders; red circles highlight smFISH spots; scale bars = 20 μm (A). Bar charts are presented as means ± s.d.

Acknowledgments
This image is the copyrighted work of the attributed author or publisher, and ZFIN has permission only to display this image to its users. Additional permissions should be obtained from the applicable author or publisher of the image. Full text @ EMBO J.