
Figure 1
- ID
- ZDB-IMAGE-201107-14
- Publication
- Costa et al., 2020 - RAB13 mRNA compartmentalisation spatially orients tissue morphogenesis
- All Figures
- Figures for Costa et al., 2020
|
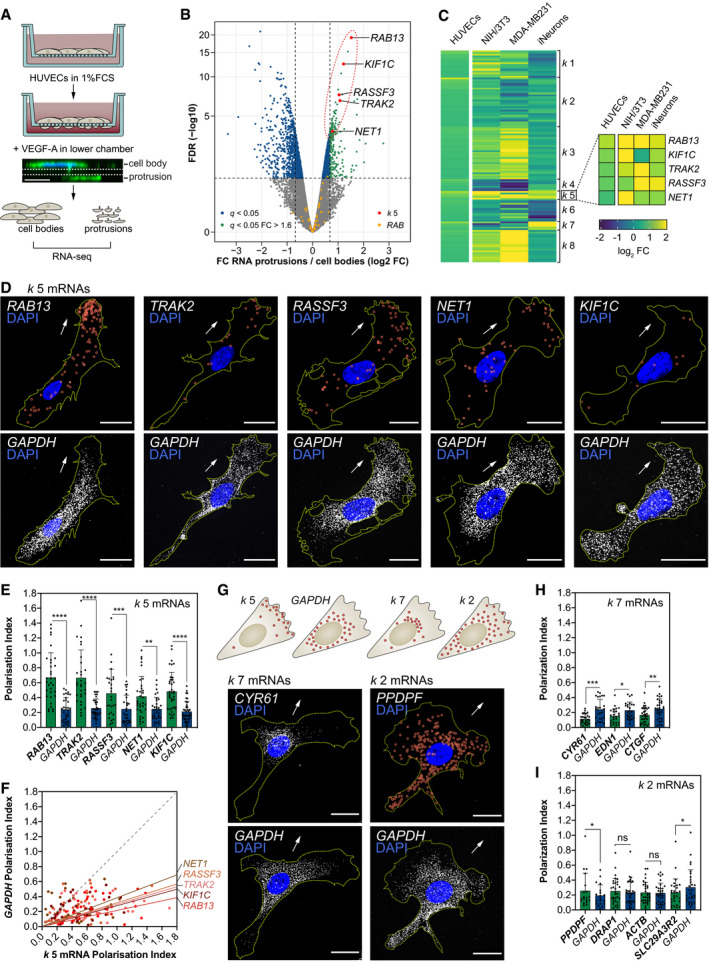
Figure 1
Strategy used to screen for mRNAs enriched in motile protrusions of HUVECs migrating through Transwell membranes. RNAseq data are plotted in log2 fold change (FC) levels of protrusions over cell bodies against adjusted −log10 false discovery rate (FDR) ( Heat map represents the smFISH co‐detection of Polarisation Index (PI) of Top: distribution pattern of mRNAs clustered in PIs of PIs of
Data information: arrows indicate orientation of RNA localisation; yellow dashed lines outline cell borders; red circles highlight smFISH spots; scale bars = 20 μm (D, G). Bar charts are presented as means ± s.d.