
- Title
-
Ground state depletion microscopy as a tool for studying microglia-synapse interactions
- Authors
- Paasila, P.J., Fok, S.Y.Y., Flores-Rodriguez, N., Sajjan, S., Svahn, A.J., Dennis, C.V., Holsinger, R.M.D., Kril, J.J., Becker, T.S., Banati, R.B., Sutherland, G.T., Graeber, M.B.
- Source
- Full text @ J. Neurosci. Res.
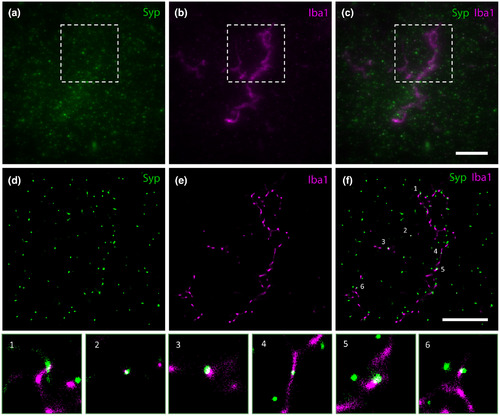
(a–c) Widefield epifluorescence images of (a) Syp‐immunostaining of presynaptic boutons, (b) Iba1‐immunostaining of a microglia profile, and (c) the composite image (case AD 1). Widefield images are shown as maximum intensity projections of 35 z‐slices with a depth of 6.65 µm; insets outline the fields of view corresponding to GSDIM reconstructions in the following row (d–f). (d–f) GSDIM reconstruction demonstrating the ability of the technique to display very high resolution images of (d) Syp‐immunostaining, (e) Iba1‐immunostaining, and (f) the composite image. The numbered spots in (f) highlight overlapping signal (white), that is, Syp‐positive presynaptic material inside Iba1‐positive microglial cell processes. Scale bar in c = 10 µm (a–c), in f = 5 µm (d–f) |
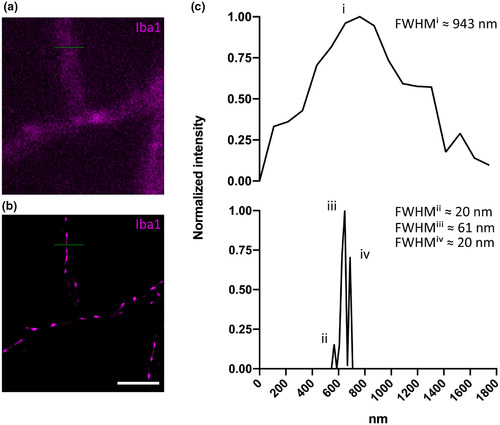
(a–b) A representative Iba1‐positive (magenta) microglial cell with a typical perpendicularly branching cell process imaged in (a) widefield and (b) GSDIM mode, respectively. (c) Normalized pixel intensity values are plotted against the diameter of the cell process measured in nanometers as marked by the corresponding green line of interest in (a) and (b), respectively. Full width at half maximum (FWHM) of the single peak in the upper chart (marked “i”) corresponds to ~943 nm for the widefield image. FWHM of the first (“ii”), second (“iii”), and third (“iv”) peak corresponding to the GSDIM reconstruction in (b) is ~20, 61, and 20 nm, respectively. Scale bar = 2.5 μm (a,b) |
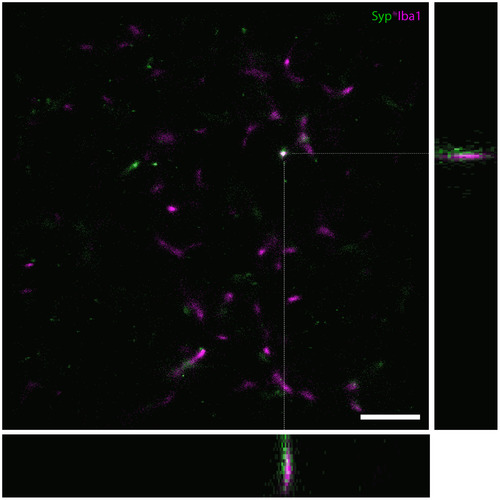
A 3D GSDIM reconstruction of part of a microglial cell from case AD 2 with a z‐depth of 0.77 µm shown as a maximum intensity projection, with orthogonal views of the XZ and YZ dimensions on the bottom and left of the image, respectively. The orthogonal views have been magnified by 1.99× and cropped for better visualization (each view represents a space that is 0.77 µm in the Z‐direction × 5.17 µm in the X‐ and Y‐direction, respectively). Scale bar = 2.5 µm (XY image only) |
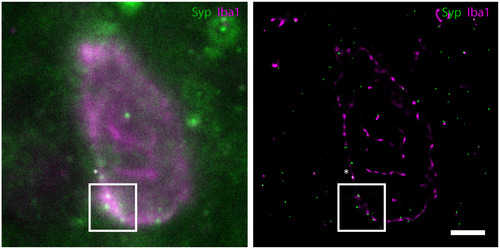
A widefield (left) and corresponding GSDIM reconstruction (right) demonstrating Iba1‐ (magenta) and Syp‐ (green) immunoreactivity in the dorsolateral prefrontal cortex of control human brain tissue (Non‐AD Control 2). The areas marked by the asterisk (*) and within the white box in the widefield image indicate instances of potential co‐localization of signals (white, merge color). The GSDIM reconstruction of the corresponding area (white box, right) better able resolves the Iba1‐ and Syp‐positive signals, illustrating the need for GSDIM resolution. The area marked by the asterisk (*) in the GSDIM reconstruction represents an instance of true signal overlap (Syp inside a microglial process; white, merge color). Examples of overlap regions (white) in the GSDIM reconstruction are indicative of Iba1 and Syp molecules that are closer than 20 nm. Scale bar = 2.5 µm |
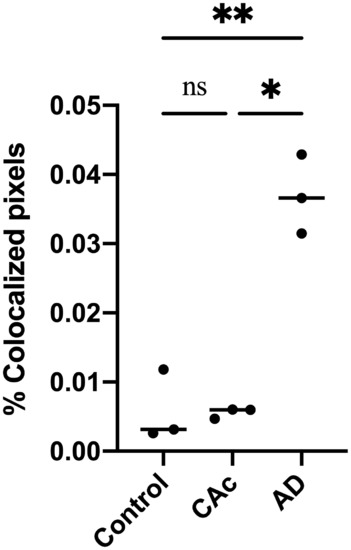
Scatterplot demonstrating an elevated average percentage of co‐localized pixels per 18 μm2 (900 pixels2) standard region of interest in AD compared to CAc and controls. *p < 0.05; **p < 0.01; ns (not significant), p > 0.99 |
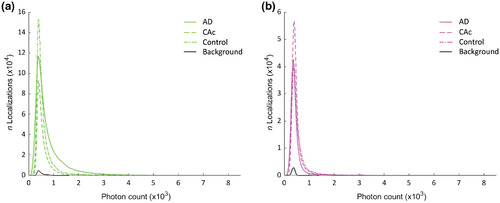
(a,b) Plots showing the number of localizations by photon count in both the (a) 647 nm (green) and (b) 532 nm (magenta) channels from Alzheimer's disease (AD) cases, Controls with Alzheimer's changes (CAc), normal controls, and background. Table 2 shows the summary statistics |
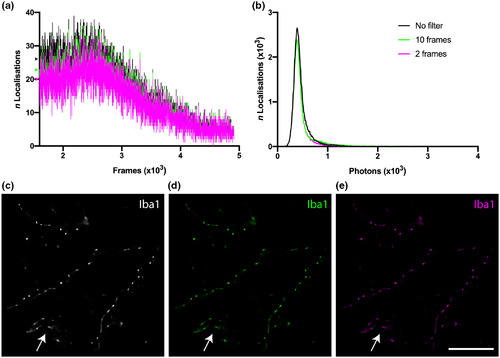
A test of the quality of GSDIM reconstructions from unfiltered data was performed in order to determine the impact of localizations that occurred through consecutive imaging frames. (a) “Blinking” events over several thousand frames in unfiltered data (black) and filtered data excluding localizations that occurred in 10 or more (green) and 2 or more (magenta) consecutive frames (the colored markers on the y axis show the shift in the average number of localizations in the first 2 × 10³ frames for each filter group). (b) The total number of localizations in the unfiltered data set was 55,006 (black), 48,913 after removing localizations occurring in 10 or more consecutive frames (green), and 45,347 after removing localizations in 2 or more consecutive frames (magenta). c–e GSDIM reconstructions of the respective event lists for (c) unfiltered data (white), and thresholds at (d) 10 (green) and (e) 2 (magenta) consecutive frames were not substantially different (arrow heads indicate Iba1‐positive staining in a likely blood vessel—shown in each image). Scale bar = 5 μm (c–e) |
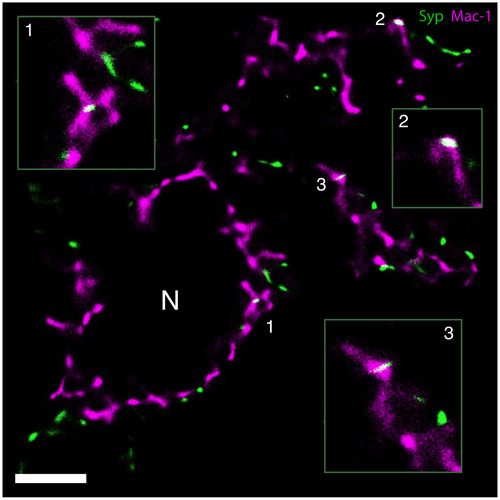
GSDIM demonstrates Syp‐immunoreactive presynaptic material (green) inside perineuronal microglial processes (Mac‐1, magenta) in the axotomized mouse facial nucleus 3 days following axotomy. Examples of stripped synapses (white, merge color) are magnified in the insets. Numbered regions represent the magnified areas in the insets. N marks a cross‐sectioned motor neuron. Scale bar = 2.5 µm |
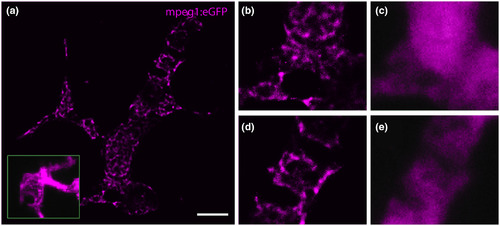
(a) GSDIM reveals the intracellular distribution of mpeg1:eGFP (magenta) in microglia in the optic tectum of a zebrafish larva. Inset in a shows an mpeg1:eGFP expressing microglial cell captured with confocal microscopy for comparison. (b,d) Magnified areas from a showing the intracellular distribution of eGFP with their widefield fluorescence images in (c) and (e), respectively. Scale bar = 5 µm (a) |