
FIGURE
Fig. 9
Fig. 9
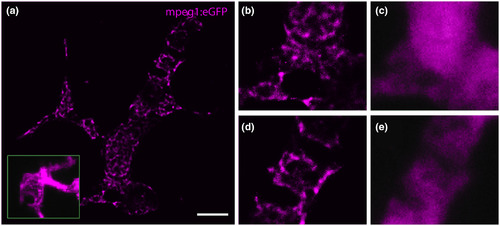
(a) GSDIM reveals the intracellular distribution of mpeg1:eGFP (magenta) in microglia in the optic tectum of a zebrafish larva. Inset in a shows an mpeg1:eGFP expressing microglial cell captured with confocal microscopy for comparison. (b,d) Magnified areas from a showing the intracellular distribution of eGFP with their widefield fluorescence images in (c) and (e), respectively. Scale bar = 5 µm (a) |
Expression Data
Expression Detail
Antibody Labeling
Phenotype Data
Phenotype Detail
Acknowledgments
This image is the copyrighted work of the attributed author or publisher, and
ZFIN has permission only to display this image to its users.
Additional permissions should be obtained from the applicable author or publisher of the image.
Full text @ J. Neurosci. Res.