
Fig. 2
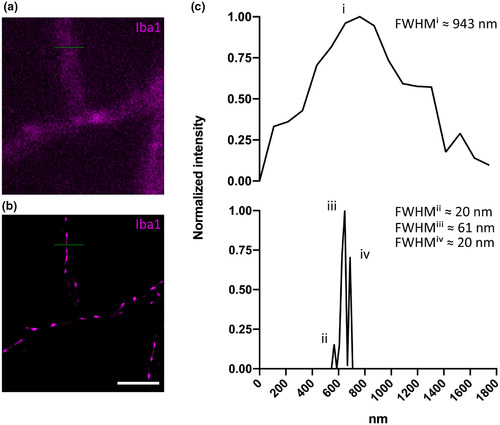
(a–b) A representative Iba1‐positive (magenta) microglial cell with a typical perpendicularly branching cell process imaged in (a) widefield and (b) GSDIM mode, respectively. (c) Normalized pixel intensity values are plotted against the diameter of the cell process measured in nanometers as marked by the corresponding green line of interest in (a) and (b), respectively. Full width at half maximum (FWHM) of the single peak in the upper chart (marked “i”) corresponds to ~943 nm for the widefield image. FWHM of the first (“ii”), second (“iii”), and third (“iv”) peak corresponding to the GSDIM reconstruction in (b) is ~20, 61, and 20 nm, respectively. Scale bar = 2.5 μm (a,b) |