
FIGURE
Fig. 6
Fig. 6
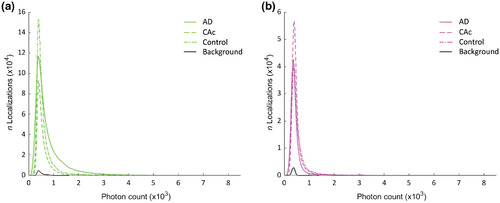
(a,b) Plots showing the number of localizations by photon count in both the (a) 647 nm (green) and (b) 532 nm (magenta) channels from Alzheimer's disease (AD) cases, Controls with Alzheimer's changes (CAc), normal controls, and background. Table 2 shows the summary statistics |
Expression Data
Expression Detail
Antibody Labeling
Phenotype Data
Phenotype Detail
Acknowledgments
This image is the copyrighted work of the attributed author or publisher, and
ZFIN has permission only to display this image to its users.
Additional permissions should be obtained from the applicable author or publisher of the image.
Full text @ J. Neurosci. Res.