
Fig. 4
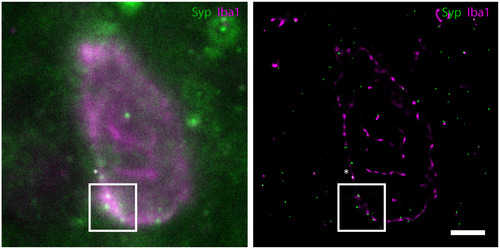
A widefield (left) and corresponding GSDIM reconstruction (right) demonstrating Iba1‐ (magenta) and Syp‐ (green) immunoreactivity in the dorsolateral prefrontal cortex of control human brain tissue (Non‐AD Control 2). The areas marked by the asterisk (*) and within the white box in the widefield image indicate instances of potential co‐localization of signals (white, merge color). The GSDIM reconstruction of the corresponding area (white box, right) better able resolves the Iba1‐ and Syp‐positive signals, illustrating the need for GSDIM resolution. The area marked by the asterisk (*) in the GSDIM reconstruction represents an instance of true signal overlap (Syp inside a microglial process; white, merge color). Examples of overlap regions (white) in the GSDIM reconstruction are indicative of Iba1 and Syp molecules that are closer than 20 nm. Scale bar = 2.5 µm |