
IMAGE
Fig. 9
- ID
- ZDB-IMAGE-210518-9
- Publication
- Paasila et al., 2021 - Ground state depletion microscopy as a tool for studying microglia-synapse interactions
- All Figures
- Figures for Paasila et al., 2021
Image
|
Figure Caption
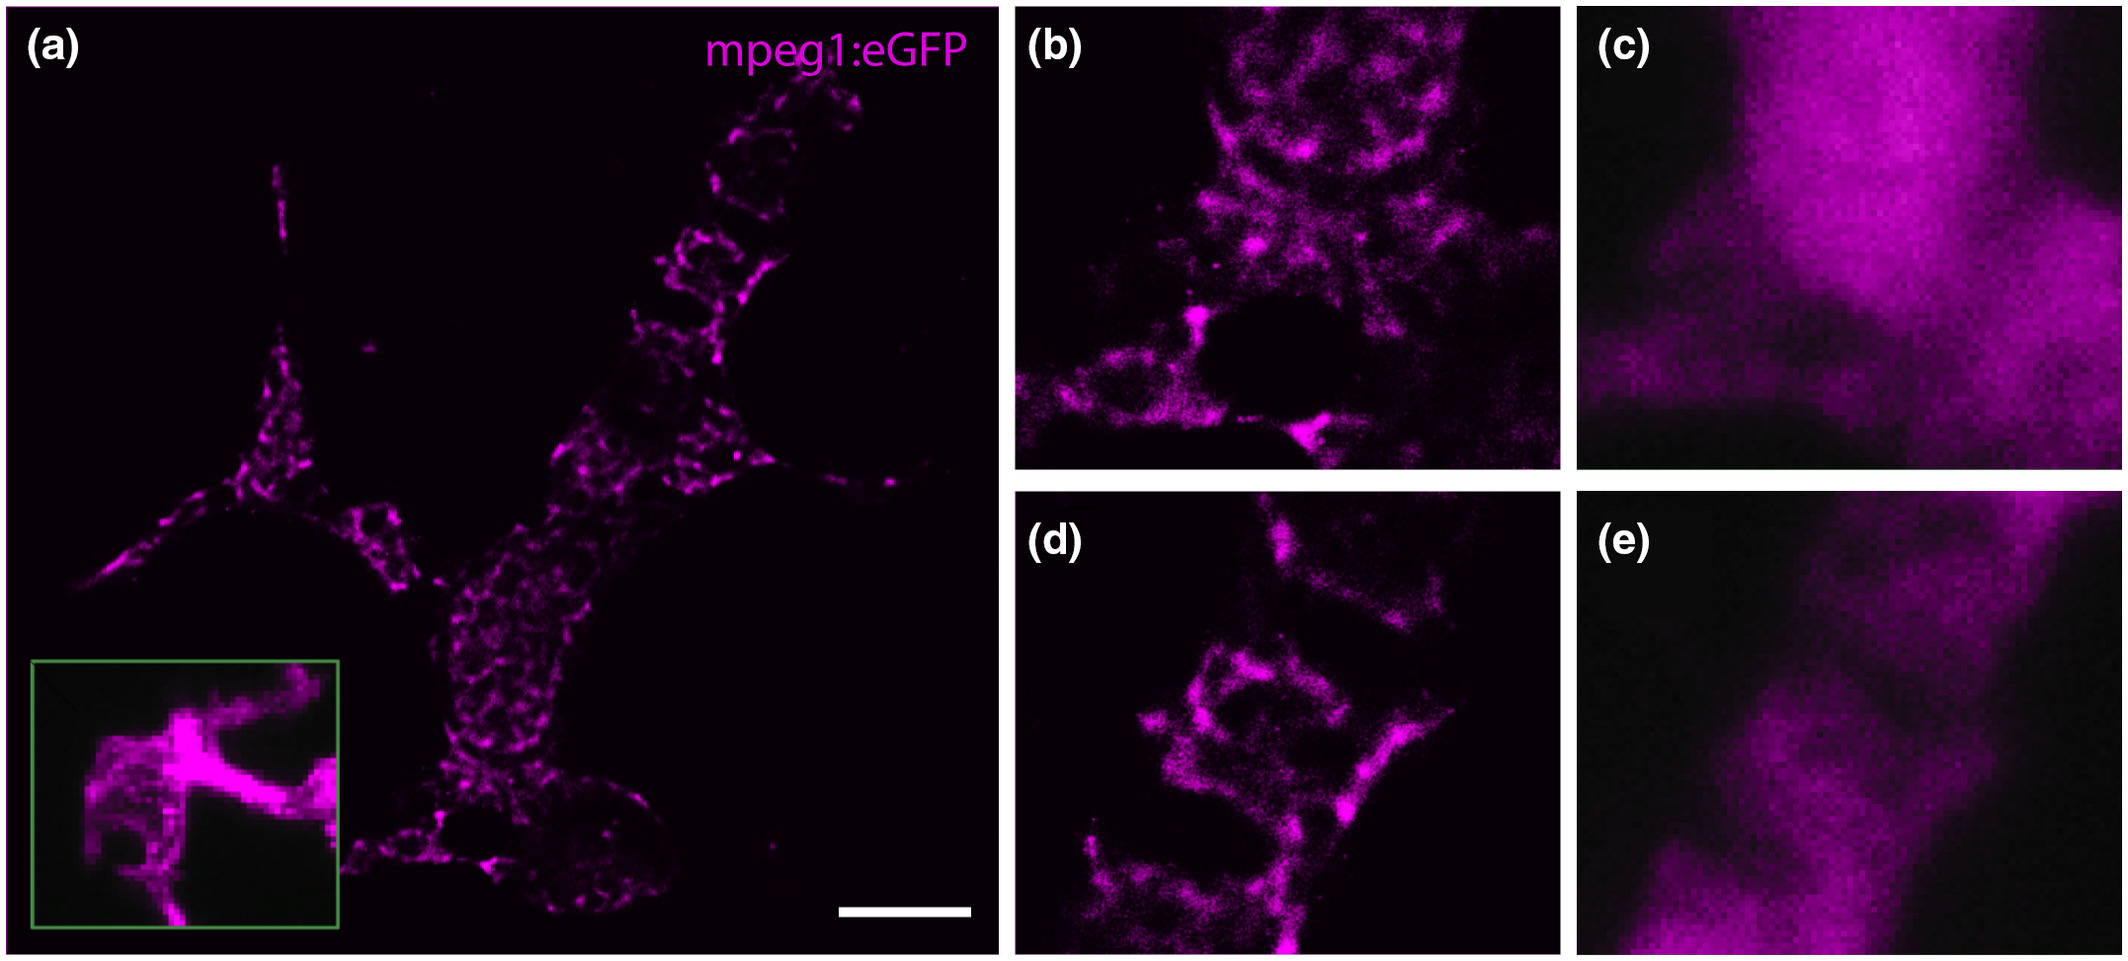
Fig. 9 (a) GSDIM reveals the intracellular distribution of mpeg1:eGFP (magenta) in microglia in the optic tectum of a zebrafish larva. Inset in a shows an mpeg1:eGFP expressing microglial cell captured with confocal microscopy for comparison. (b,d) Magnified areas from a showing the intracellular distribution of eGFP with their widefield fluorescence images in (c) and (e), respectively. Scale bar = 5 µm (a)
Acknowledgments
This image is the copyrighted work of the attributed author or publisher, and
ZFIN has permission only to display this image to its users.
Additional permissions should be obtained from the applicable author or publisher of the image.
Full text @ J. Neurosci. Res.