
Fig. 1
- ID
- ZDB-IMAGE-210518-1
- Publication
- Paasila et al., 2021 - Ground state depletion microscopy as a tool for studying microglia-synapse interactions
- All Figures
- Figures for Paasila et al., 2021
|
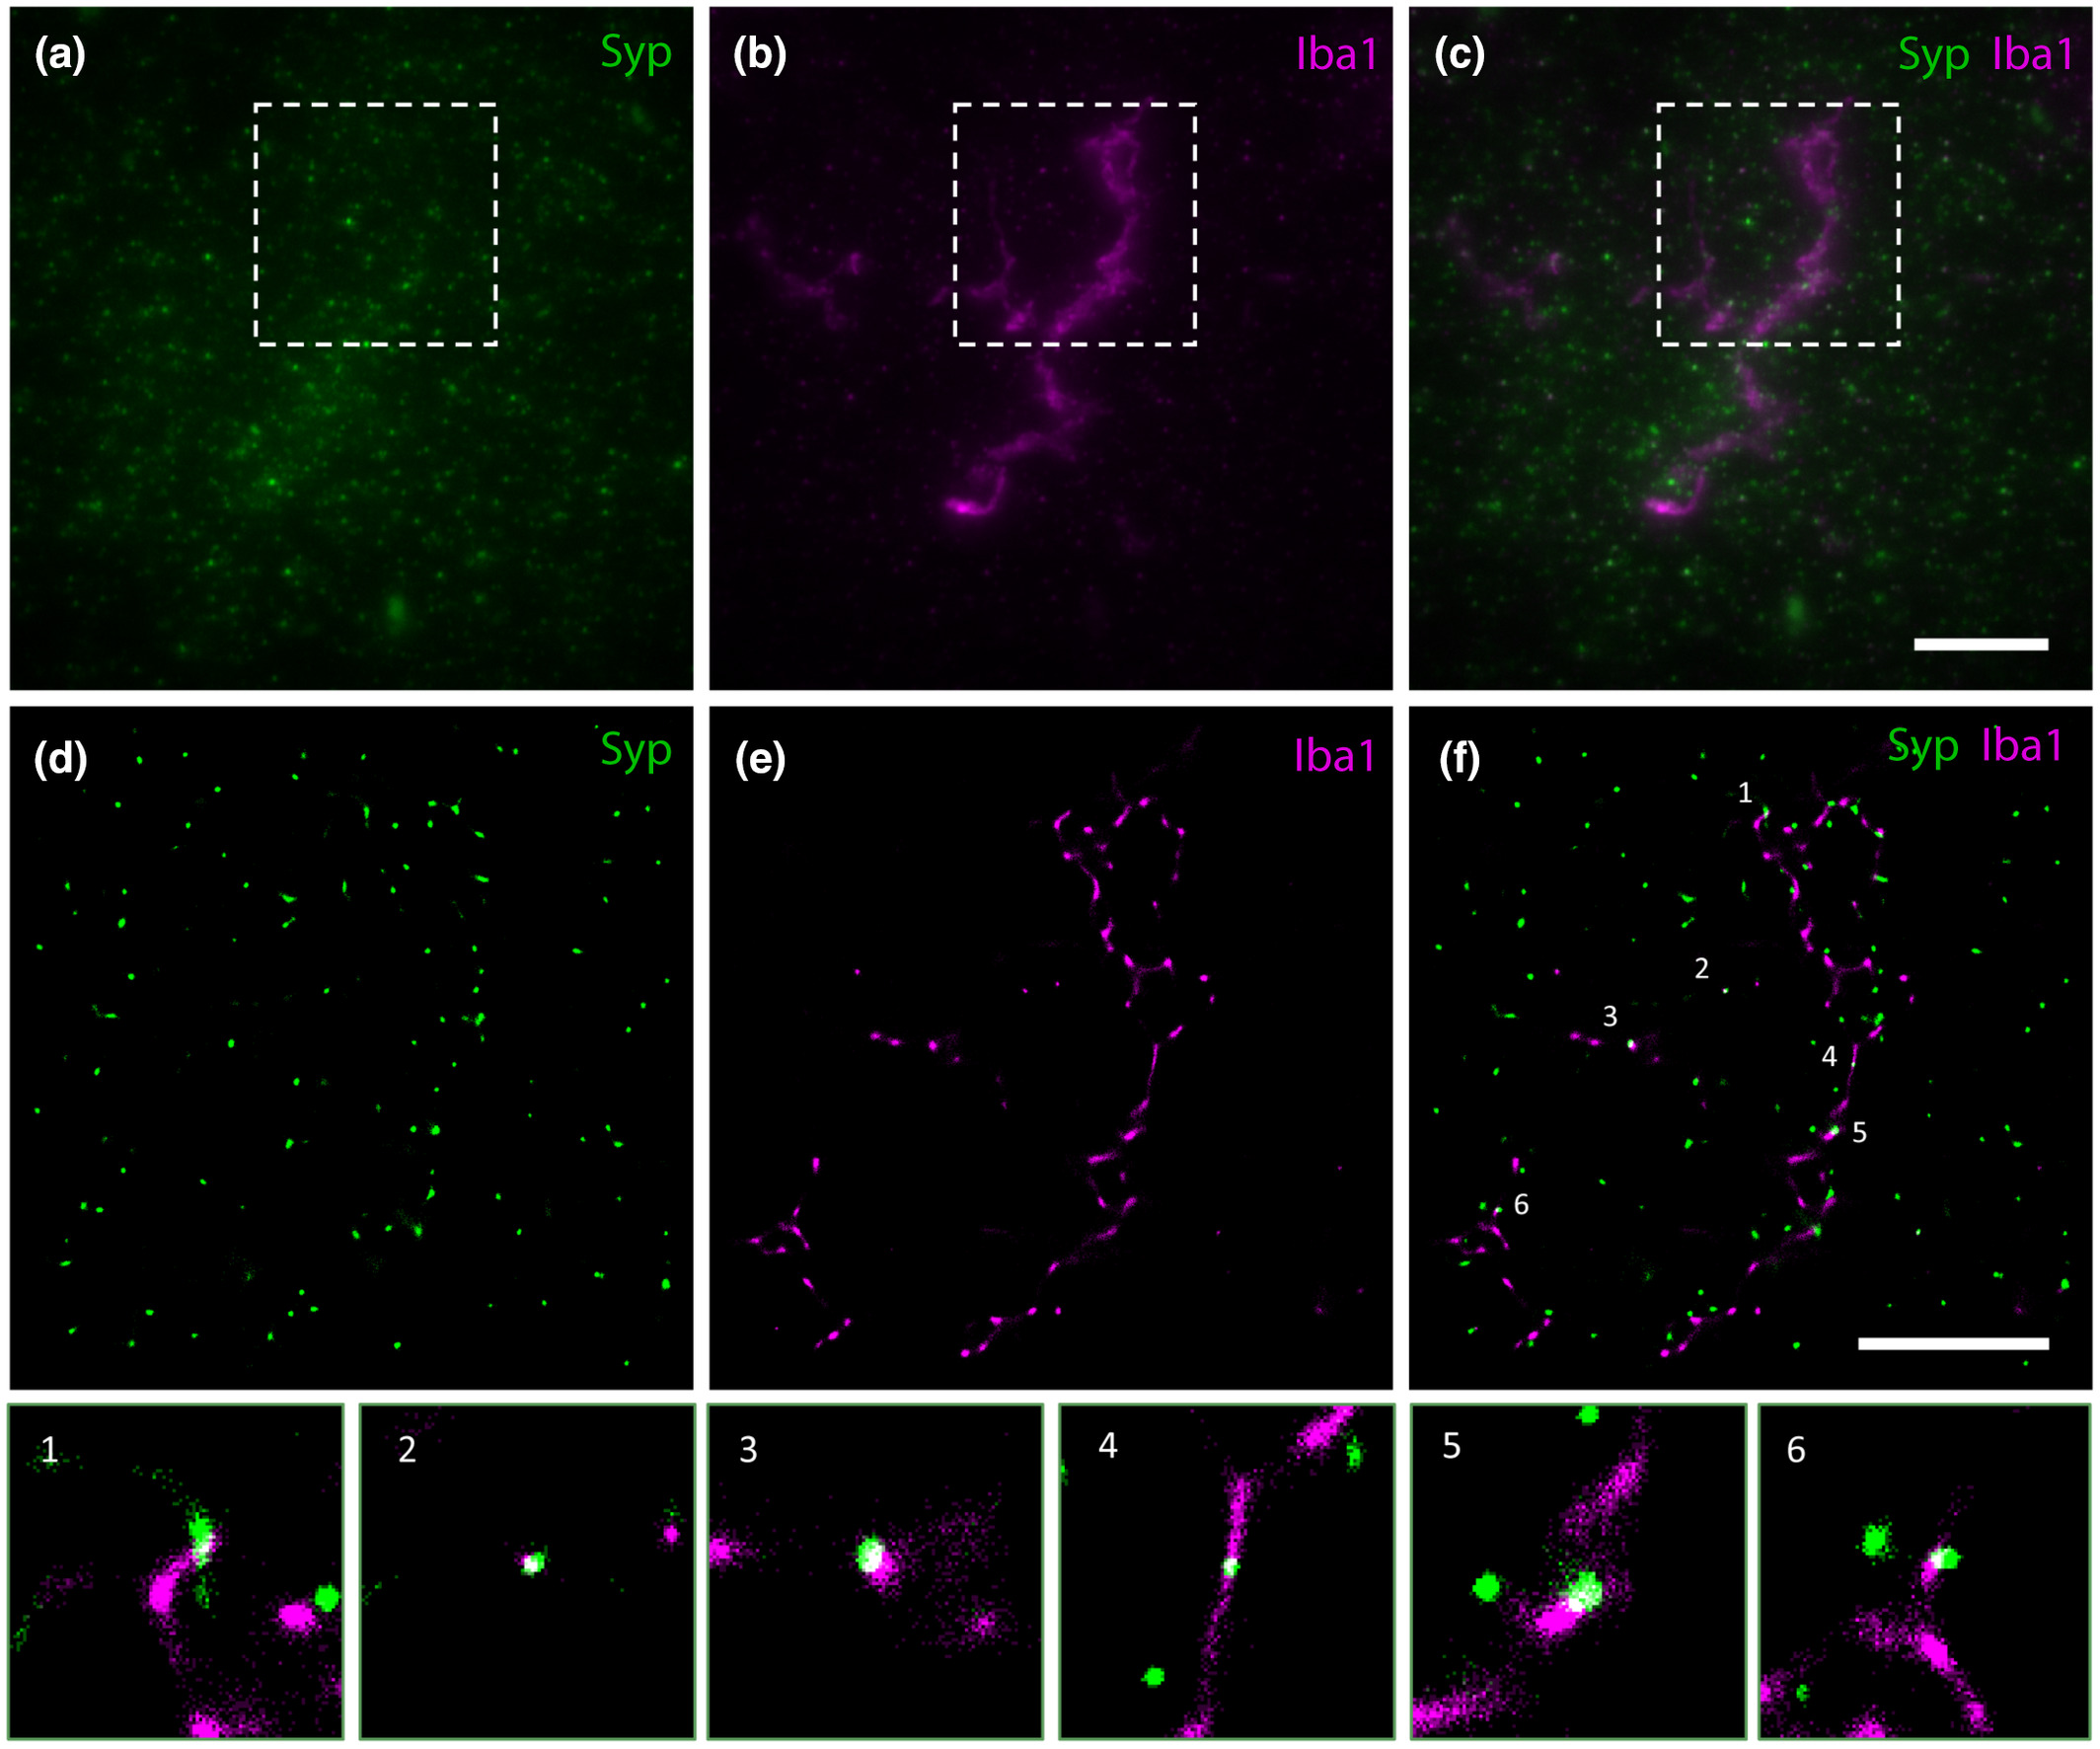
Fig. 1 (a–c) Widefield epifluorescence images of (a) Syp‐immunostaining of presynaptic boutons, (b) Iba1‐immunostaining of a microglia profile, and (c) the composite image (case AD 1). Widefield images are shown as maximum intensity projections of 35 z‐slices with a depth of 6.65 µm; insets outline the fields of view corresponding to GSDIM reconstructions in the following row (d–f). (d–f) GSDIM reconstruction demonstrating the ability of the technique to display very high resolution images of (d) Syp‐immunostaining, (e) Iba1‐immunostaining, and (f) the composite image. The numbered spots in (f) highlight overlapping signal (white), that is, Syp‐positive presynaptic material inside Iba1‐positive microglial cell processes. Scale bar in c = 10 µm (a–c), in f = 5 µm (d–f)