
Fig. 7
- ID
- ZDB-IMAGE-210518-7
- Publication
- Paasila et al., 2021 - Ground state depletion microscopy as a tool for studying microglia-synapse interactions
- All Figures
- Figures for Paasila et al., 2021
|
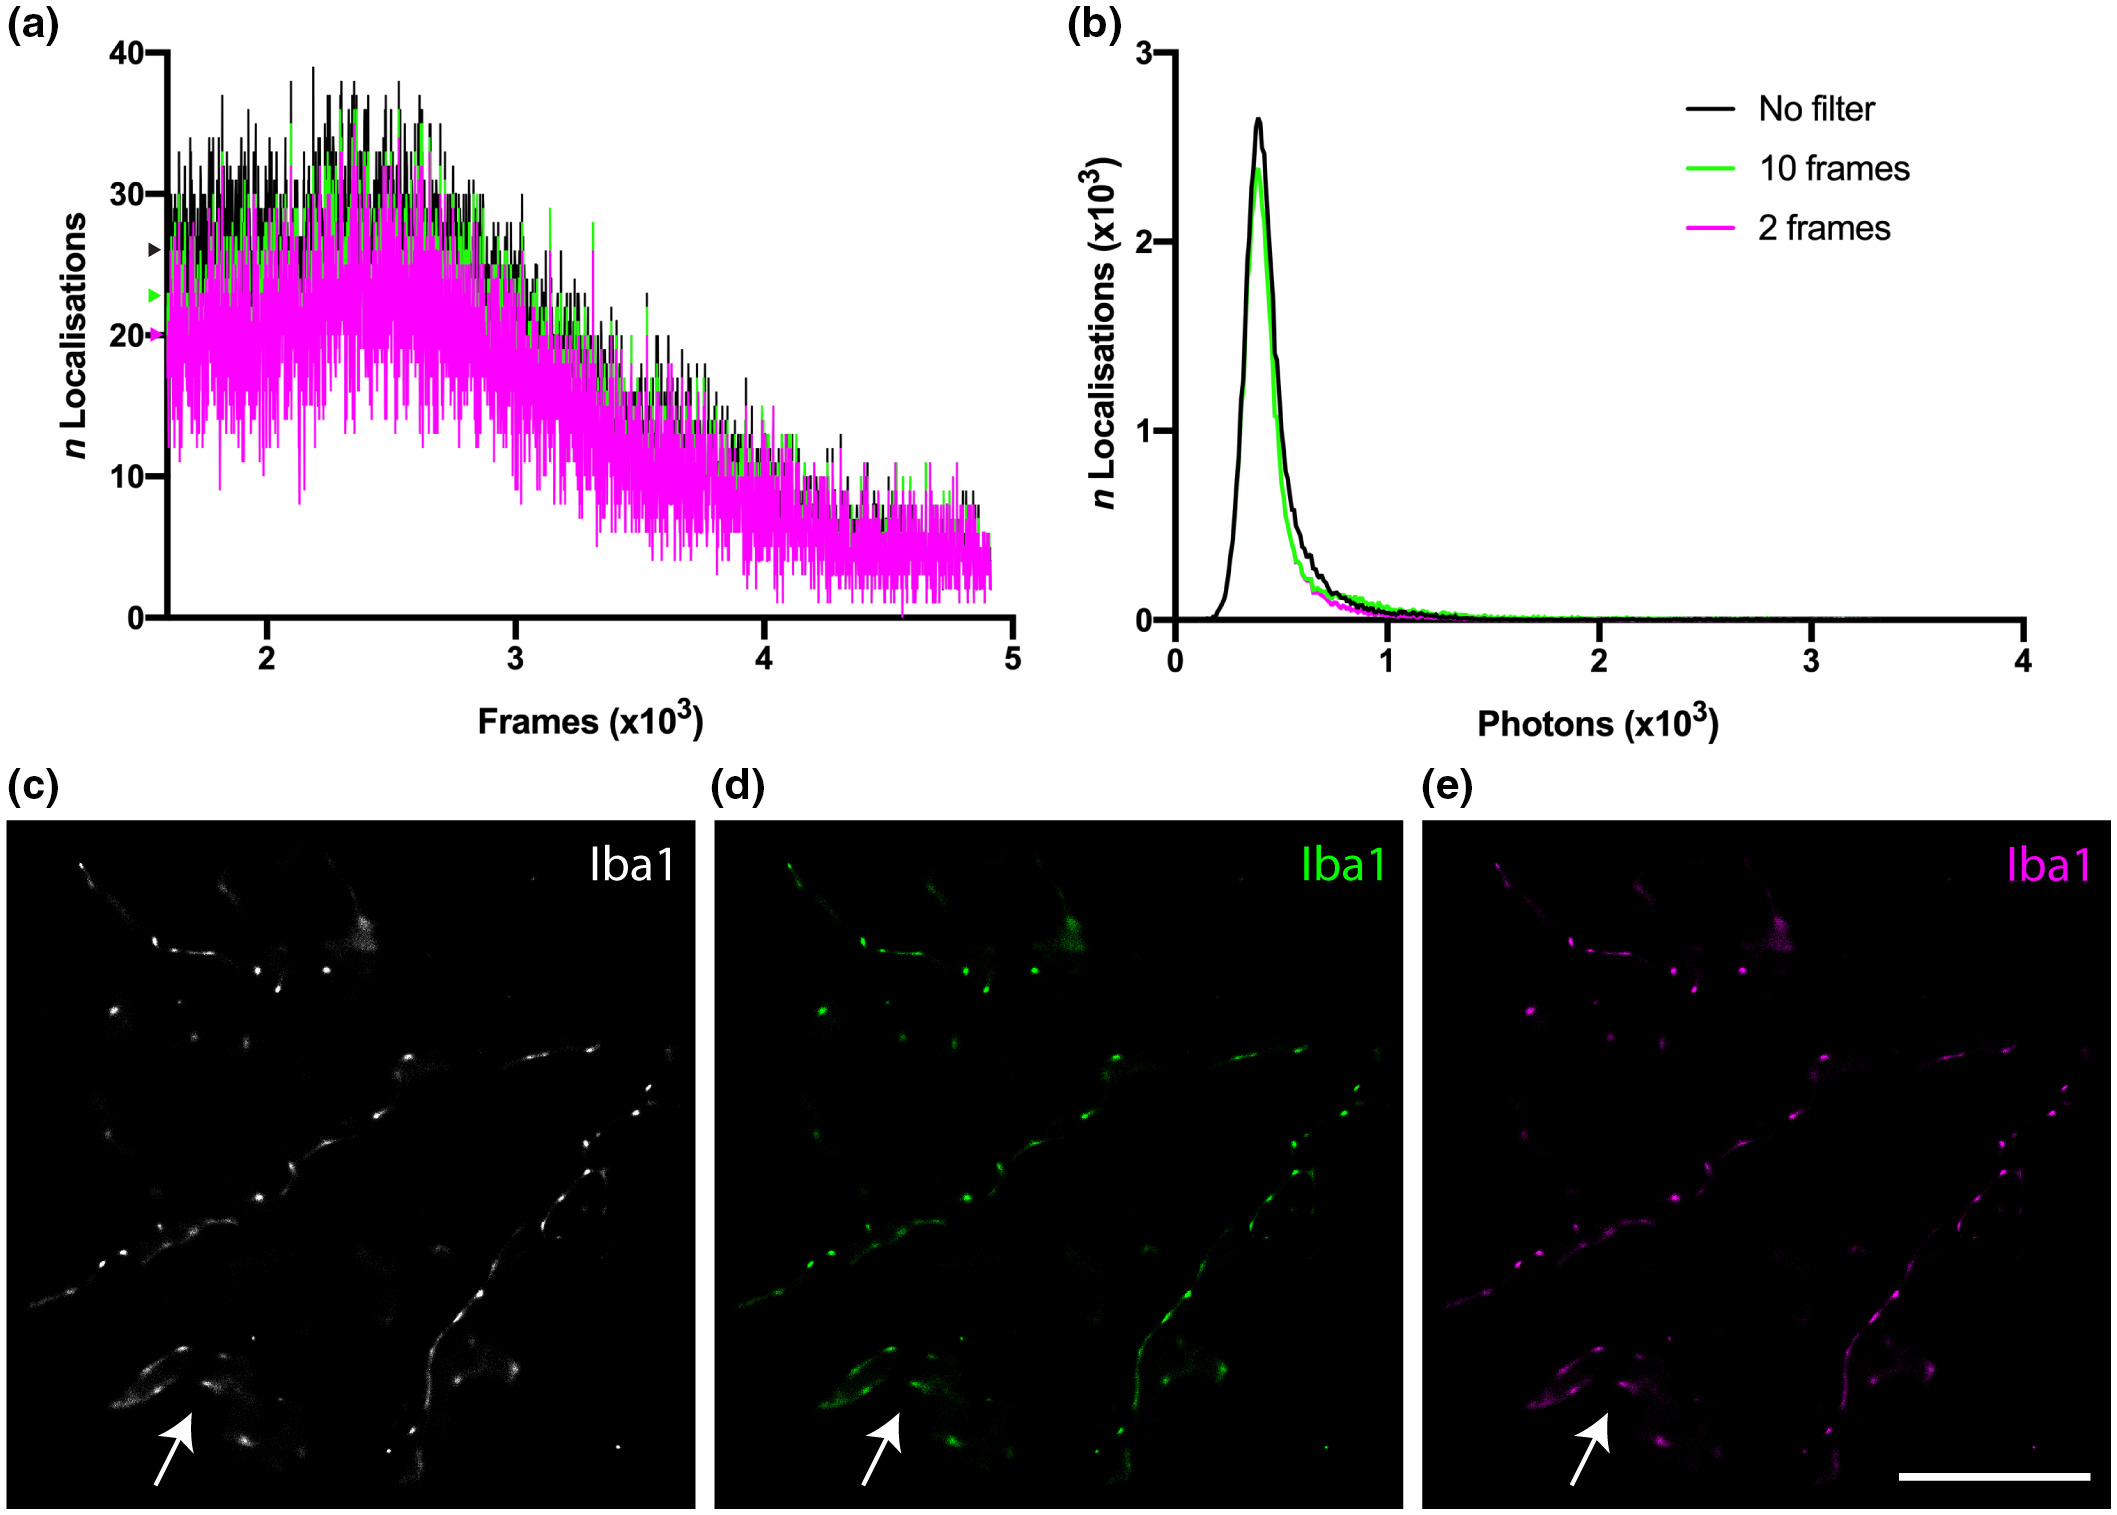
Fig. 7 A test of the quality of GSDIM reconstructions from unfiltered data was performed in order to determine the impact of localizations that occurred through consecutive imaging frames. (a) “Blinking” events over several thousand frames in unfiltered data (black) and filtered data excluding localizations that occurred in 10 or more (green) and 2 or more (magenta) consecutive frames (the colored markers on the y axis show the shift in the average number of localizations in the first 2 × 10³ frames for each filter group). (b) The total number of localizations in the unfiltered data set was 55,006 (black), 48,913 after removing localizations occurring in 10 or more consecutive frames (green), and 45,347 after removing localizations in 2 or more consecutive frames (magenta). c–e GSDIM reconstructions of the respective event lists for (c) unfiltered data (white), and thresholds at (d) 10 (green) and (e) 2 (magenta) consecutive frames were not substantially different (arrow heads indicate Iba1‐positive staining in a likely blood vessel—shown in each image). Scale bar = 5 μm (c–e)