
IMAGE
Fig. 5
- ID
- ZDB-IMAGE-210518-5
- Publication
- Paasila et al., 2021 - Ground state depletion microscopy as a tool for studying microglia-synapse interactions
- All Figures
- Figures for Paasila et al., 2021
Image
|
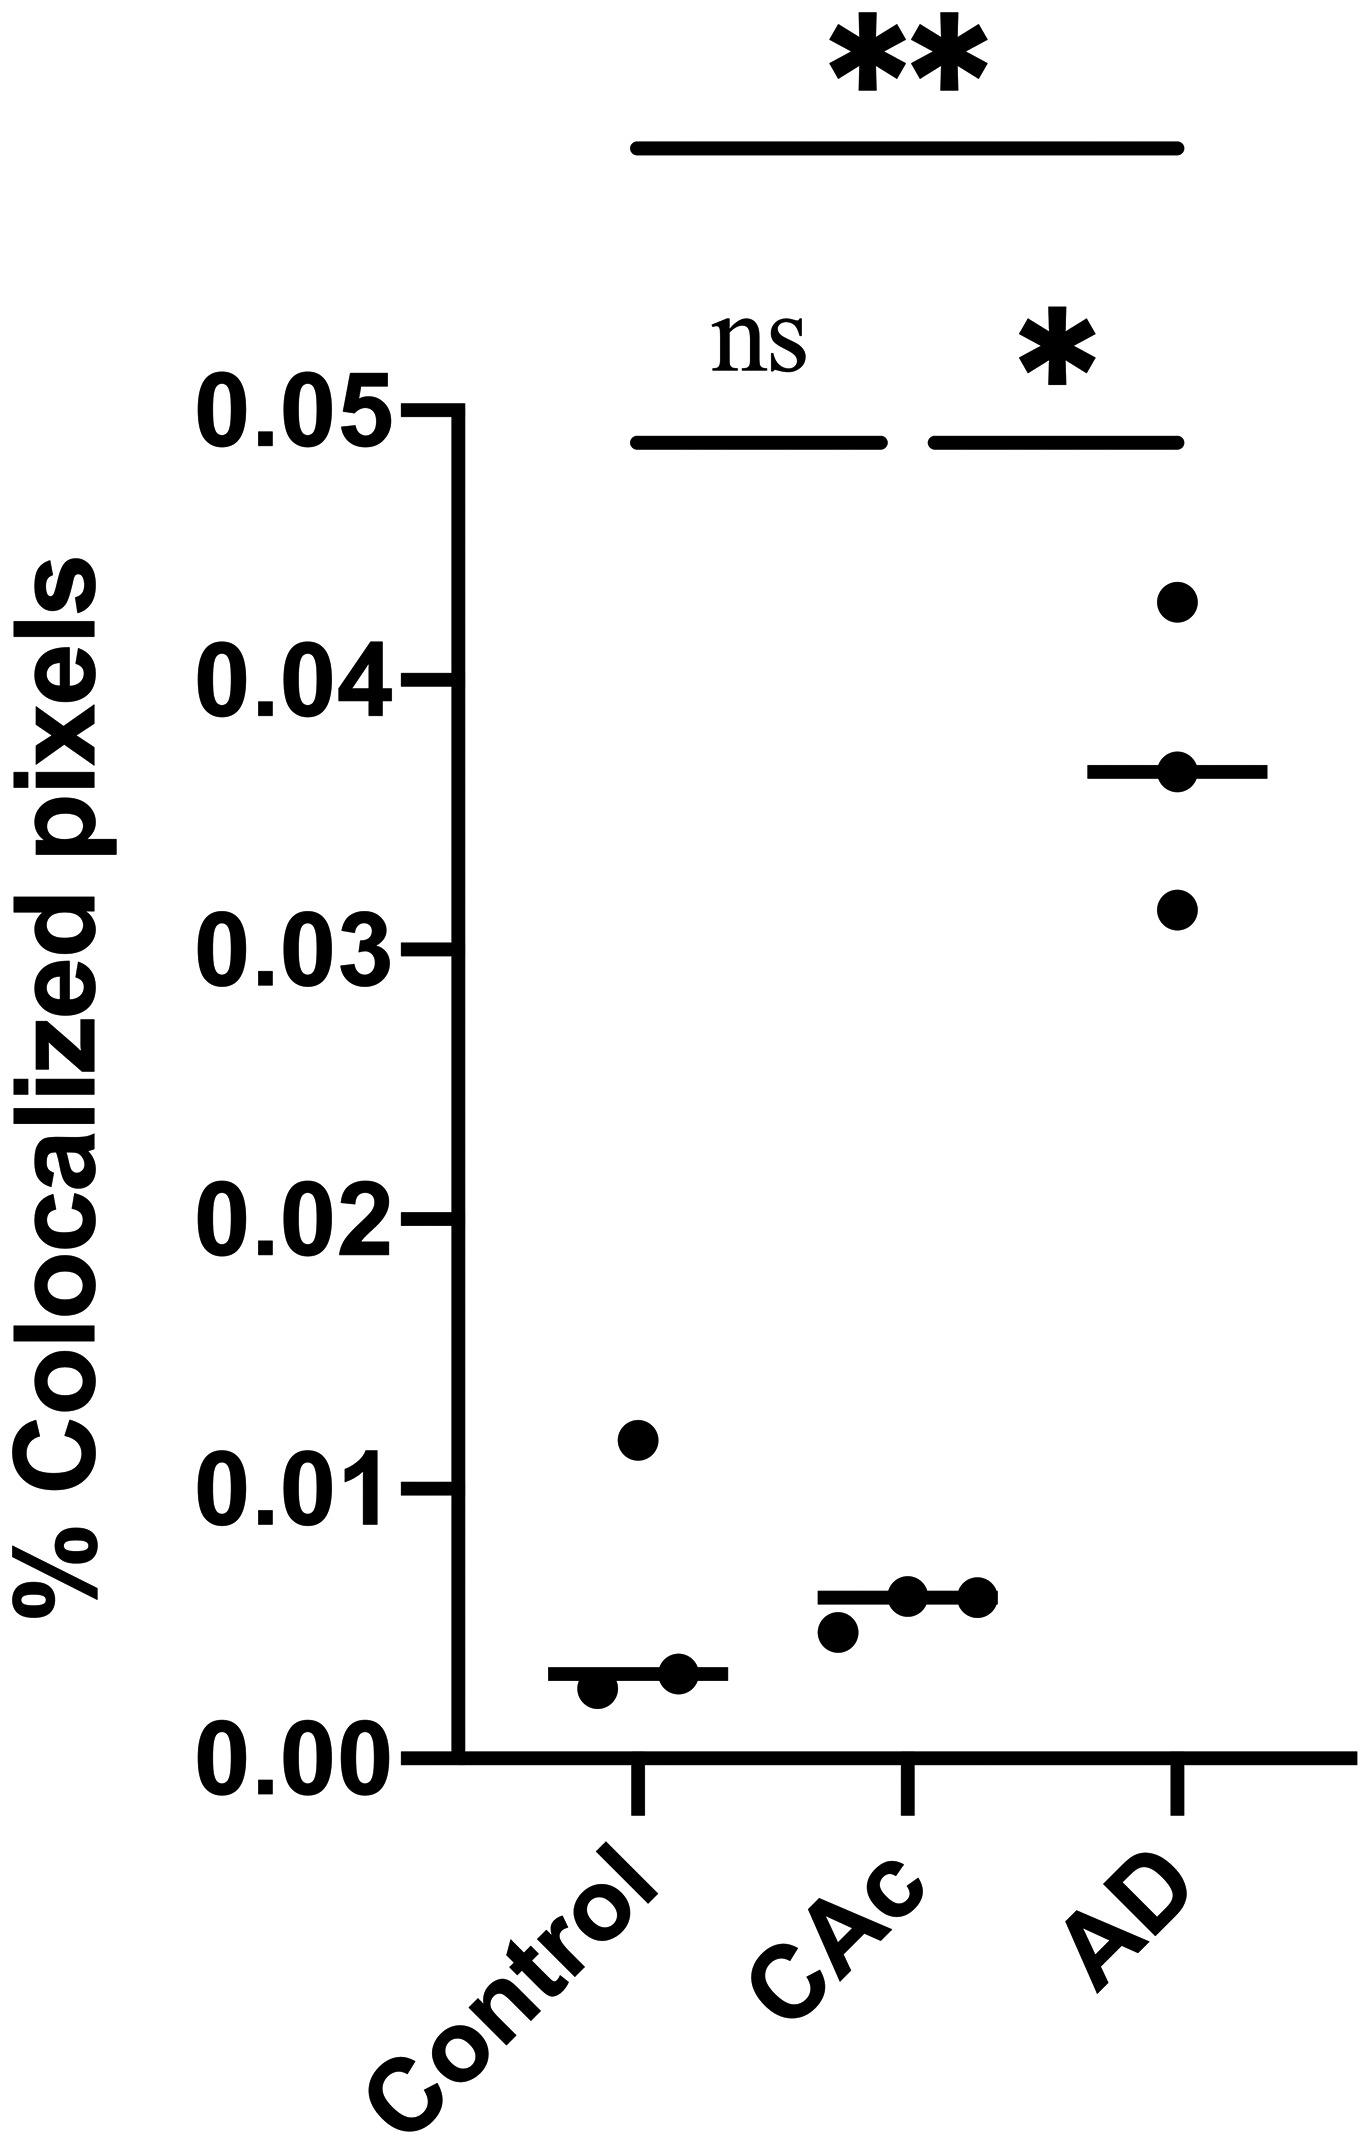
Figure Caption
Fig. 5 Scatterplot demonstrating an elevated average percentage of co‐localized pixels per 18 μm2 (900 pixels2) standard region of interest in AD compared to CAc and controls. *p < 0.05; **p < 0.01; ns (not significant), p > 0.99
Acknowledgments
This image is the copyrighted work of the attributed author or publisher, and
ZFIN has permission only to display this image to its users.
Additional permissions should be obtained from the applicable author or publisher of the image.
Full text @ J. Neurosci. Res.