
- Title
-
Caveolae Protect Notochord Cells against Catastrophic Mechanical Failure during Development
- Authors
- Lim, Y.W., Lo, H.P., Ferguson, C., Martel, N., Giacomotto, J., Gomez, G.A., Yap, A.S., Hall, T.E., Parton, R.G.
- Source
- Full text @ Curr. Biol.
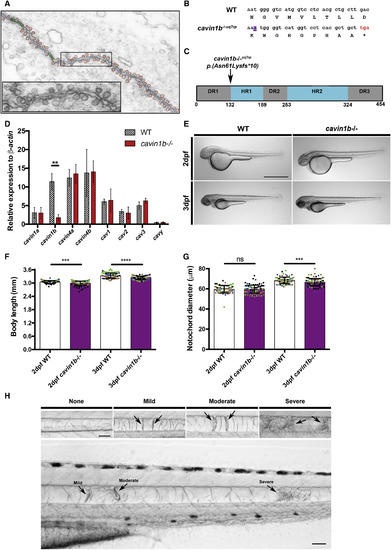
Mutant cavin1b−/− Zebrafish Exhibit Notochord Lesions (A) Electron micrograph depicting dense caveolae in the septum between two neighboring zebrafish embryonic notochord cells. Superimposed schematic trace highlights abundant caveolae (red), plasma membrane (blue), and junctions (green). The inset shows magnification of highlighted area. (B) Alignment of nucleotide and deduced amino acid sequences from WT and cavin1b−/− lines. An adenine insertion in the mutant sequence is highlighted in purple and underlined. Asterisk (∗) indicates the truncating stop codon in the mutant sequence (marked in red). See Figures S1A–S1E for cavin1b CRISPR/Cas9 mutant generation and genotyping. (C) Cavin1b protein domains (schematic). Arrow indicates the site of predicted truncation of selected mutant. The DR (disordered region) and HR (helical region) protein regions are boxed in gray and blue, respectively. Standard sequence mutation nomenclature is used [6]. (D) mRNA expression levels of caveola-associated genes by qRT-PCR (relative to β-actin). 5-dpf WT and cavin1b−/− embryos are shown (n = 3 clutches; performed in triplicate). See Figure S1F for related RT-PCR gel. ∗∗p ≤ 0.01; two-way ANOVA with Tukey’s multiple-comparison test. Data are presented as mean ± SD. See Table S1 for primer details. (E) Gross morphology of live 2- and 3-dpf WT and cavin1b−/− embryos (treated with 1-phenyl-2-thiourea [PTU] to inhibit melanization). The scale bar represents 1 mm. (F) Body length (mm) in 2- and 3-dpf WT and cavin1b−/− embryos (2 dpf: n = 62 [WT] and n = 93 [mutant]; 3 dpf: n = 76 [WT] and n = 100 [mutant]). Four clutches per group are shown. Colored dots indicate different clutches. (G) Notochord diameter (μm) of 2- and 3-dpf WT and cavin1b−/− embryos (2 dpf: n = 65 [WT] and n = 94 [mutant]; 3 dpf: n = 79 [WT] and n = 100 [mutant]). Four clutches per group are shown. For observations on live chordamesoderm transition, see Figure S2A. For characterization of notochord vacuole formation, see Figures S2B–S2F. For (F)–(G), ns, p > 0.05; ∗∗∗p ≤ 0.001; ∗∗∗∗p ≤ 0.0001; two-tailed t tests. Data are presented as mean ± SD. (H) Notochord lesions. (Top row) Notochord lesions of varying severity (mild, moderate, or severe) are shown. (Bottom row) Representative image of a 3-dpf cavin1b−/− notochord possessing all three qualities of lesion severity is shown. The scale bar represents 50 μm. See Figures S1G and S1H for lesions in another cavin1b mutant line. |
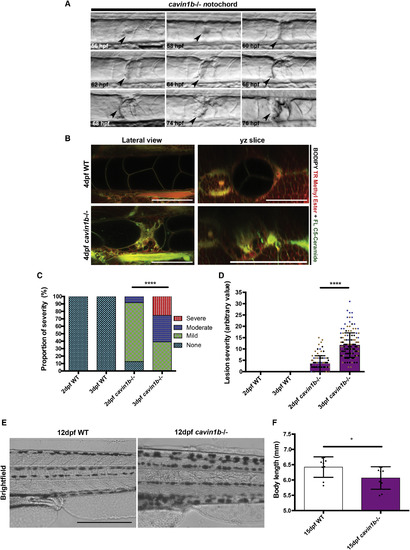
Notochord Lesions Manifest in Varying Severity and Number (A) Initiation of lesion formation in a live cavin1b−/− embryo from 56 hpf to 76 hpf (arrowhead marks lesion). The scale bar represents 50 μm. (B) Accumulation of intravital markers of plasma membrane (green, BODIPY FL C5-Ceramide) and endomembranes (red, BODIPY TR methyl ester). Live confocal images of 4-dpf WT and cavin1b−/− notochords are shown. Lateral and transverse images are taken from the same z stack. The scale bar represents 100 μm. For characterization of underlying actin cortex, including actin status in lesions and cortical tension, see Figures S3A–S3H. (C) Proportion of lesions classed as mild, moderate, or severe between 2 and 3 dpf in WT and cavin1b−/− embryos. ∗∗∗∗p ≤ 0.0001; chi square test. (D) Progression of individual phenotypic severity between 2 and 3 dpf using the “severity index,” a function of lesion number and lesion severity in WT and cavin1b−/− embryos. Colored dots indicate different clutches. ∗∗∗∗p ≤ 0.0001; two-tailed t test. For (C) and (D), 2 dpf: n = 62 (WT) and n = 72 (mutant); 3 dpf: n = 93 (WT) and n = 144 (mutant); three clutches per group. Data are presented as mean ± SD. For number of lesions per fish, see Figure S6A. (E) Live images of late-stage (12 dpf) larval notochords. Note the irregular cellular morphology in cavin1b−/− compared to WT. The scale bar represents 400 μm. (F) Body length of 15-dpf WT and cavin1b−/− larvae (n = 9; clutch = 2 each group). ∗p ≤ 0.05; two-tailed t test. Data are presented as mean ± SD. See Figures S3I and S3J for calcein staining of 15-dpf embryos. PHENOTYPE:
|
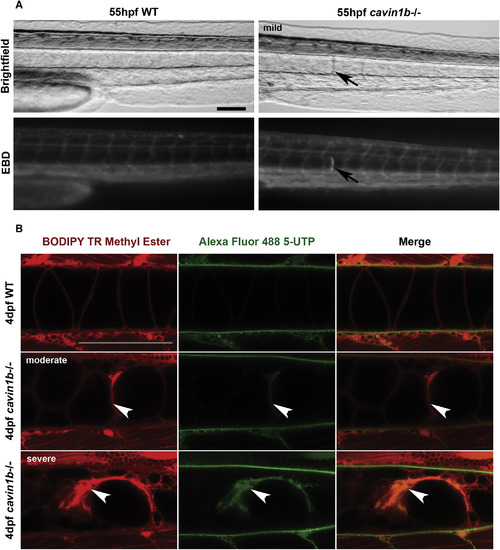
Notochord Lesions Are Damaged and Membrane-Permeable Cells (A) Evans Blue Dye (EBD) infiltration into membrane-compromised notochord cells in live 55-hpf embryos. Arrows mark the mild lesion with corresponding specific EBD uptake. Note no uptake in skeletal muscles. Four fish per group are shown. The scale bar represents 100 μm. (B) Alexa 488 5-UTP infiltration into membrane-compromised notochord cells in live 4-dpf embryos. Colocalization of Alexa 488 5-UTP with BODIPY TR methyl ester (endomembranes) occurred in moderate (middle row) and severe lesions (bottom row). No uptake in skeletal muscles was observed. Arrowheads mark lesions. n = 5 (WT) and n = 10 (mutant). The scale bar represents 100 μm. |
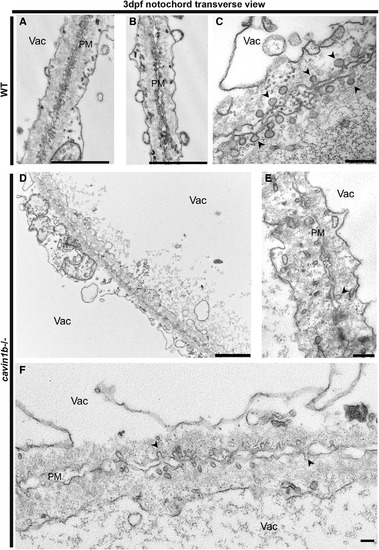
Transverse Ultrastructure of 3-dpf cavin1b−/− Notochords Ultrastructure of the junction between two neighboring notochord cells in non-lesion sites from WT (A–C) and cavin1b−/− (D–F) zebrafish embryos. Higher magnification in (C) shows dense caveolae in the membranes of adjacent cells in WT. Higher magnification in (E) and (F) highlights loss of caveola density in the septa between cavin1b−/− cells. Black arrowheads indicate caveolae. Note the differences in morphology between 3-dpf WT and cavin1b−/− caveolae. For quantitation of caveola number and shape description, refer to Figures S4A–S4D. PM, plasma membrane; Vac, vacuole. The scale bars represent (A, B, and D–F) 2 μm and (C) 200 nm. For ultrastructure of skeletal muscle, refer to Figure S4E. |
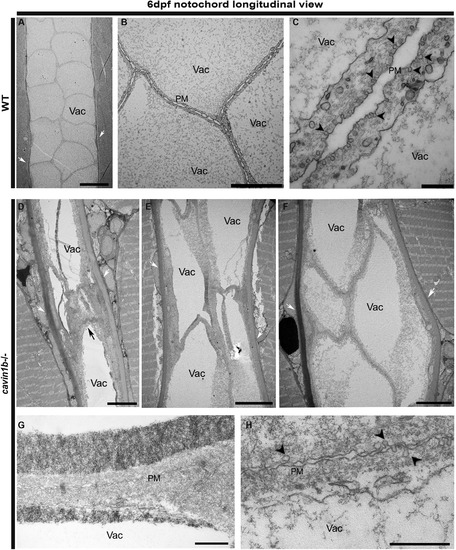
Longitudinal Ultrastructure of 6-dpf cavin1b−/− Notochords (A–C) Electron micrographs of a notochord longitudinal section from a 6-dpf WT embryo. Magnified view in (B) shows tightly apposed neighboring notochordal cells. (C) depicts neighboring notochord cells and caveolae. (D–F) Longitudinal electron micrographs of notochord regions in lesion-rich sites from 6-dpf cavin1b−/− embryos, each image representing a different zebrafish. Note aberrantly shaped vacuoles and disrupted cell morphology. For correlative light microscopy image of lesion presented in (D), refer to Figure S4F. (G and H) Longitudinal electron micrographs of cavin1b−/− cell-cell septum between notochord cells showing a prominent reduction in caveola number. Black arrow, notochord lesion; black arrowhead, caveola; white arrow, perinotochordal sheath. The scale bars represent (A, B, and D–F) 10 μm and (C, G, and H) 500 nm. PHENOTYPE:
|
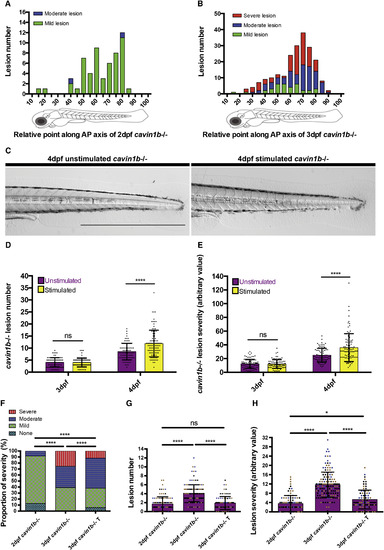
Notochord Lesion Formation and Severity Is Dependent on Locomotion (A and B) Frequency of mild, moderate, and severe lesions along the anterior-posterior (AP) axis of 2-dpf (A) and 3-dpf (B) cavin1b−/− embryos. No severe lesions were observed in 2-dpf embryos. Two clutches per group are shown; n = 30 (2 dpf) and n = 44 (3 dpf). (C) Live image of a 4-dpf cavin1b−/− embryo after electrical stimulation (10 min) at 3 dpf and corresponding unstimulated cavin1b−/− control. Note that there are no skeletal muscle perturbations upon stimulation. The scale bar represents 1 mm. Images of WT controls after electrical stimulation are shown in Figure S6F. For the effects of electrical stimulation on the surface ultrastructure, see Figures S5A–S5D. (D and E) Notochord lesion number (D) and severity index (E) for 3-dpf embryos and corresponding 4-dpf cavin1b−/− embryos after electrical stimulation (10 min) at 3 dpf and corresponding unstimulated controls. ns, p > 0.05; ∗∗∗∗p ≤ 0.0001; two-way ANOVA with Tukey’s multiple-comparison test. Data are presented as mean ± SD; four clutches per group; n per group > 80. For proportion of notochord lesion severity, see Figure S6G. For a different mechanical loading experiment (chorion bleaching), see Figures S6B–S6E. (F) Proportion of lesion severity in notochords of 3-dpf cavin1b−/− embryos following anesthesia in tricaine (T) for 24 hr compared to 2- and 3-dpf unanesthetized cavin1b−/− embryos. ∗∗∗∗p ≤ 0.0001; chi square test. (G and H) Lesion number (G) and severity index (H) in 3-dpf cavin1b−/− embryos following anesthesia in T for 24 hr compared to 2- and 3-dpf unanesthetized cavin1b−/− embryos. ns, p > 0.05; ∗p ≤ 0.05; ∗∗∗∗p ≤ 0.0001; one-way ANOVA with Tukey’s multiple-comparison test. Data are presented as mean ± SD. For (F)–(H), n per group = 93 (2 dpf), 144 (3 dpf), and 83 (3 dpf with tricaine). Three clutches per group are shown. For tricaine washout experiments, refer to Figures S7A and S7B. |
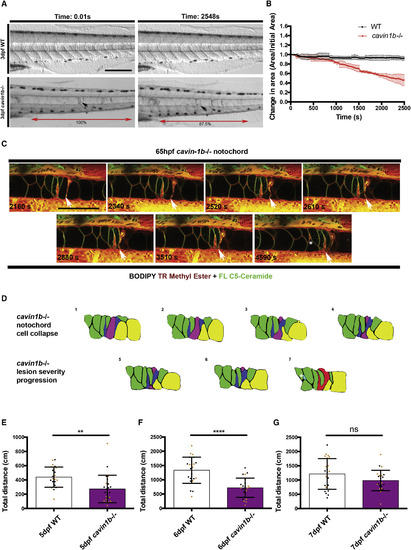
Live Imaging of cavin1b−/− Notochord Cell Collapse from Prolonged Electrical Stimulation (A) Video image stills of live 3-dpf cavin1b−/− and WT embryos before and after prolonged electrical stimulation (∼40 min). Note the change in morphology of a lesion (arrow) and the shortening of the body axis of the cavin1b−/− embryo (red double-headed arrow indicates distance between two pigment cells is reduced by 12.5%). The scale bar represents 100 μm. (B) Change in notochord area spanning six somites under prolonged electrical stimulation (∼40 min). Change in area is expressed as a ratio of initial area. Time interval = 30 s. Clutch size and n per group = 3. Data are presented as mean ± SD. (C) Live confocal time-lapse images of a 65-hpf cavin1b−/− notochord colabeled with BODIPY TR methyl ester (endomembranes) and BODIPY FL C5-Ceramide (plasma membrane) under prolonged electrical stimulation (~76 min). Frame rate = 90 s; time stamp expressed in seconds. White arrow indicates a collapsing notochord cell region. A white asterisk marks the emergence of a new lesion between neighboring notochord cell borders. The scale bar represents 100 μm. For corresponding WT control, see Figure S6H. See also Movie S1. (D) Traces of confocal image sequences depicted in (C). Notochord cell membranes are traced. Prolonged electrical stimulation induces cellular collapse (purple-shaded cell), leaving behind membranous debris. Neighboring cells (shaded green) change shape to accommodate these morphological changes (prominent shape changes highlighted in yellow-shaded cells). During this sequence, two moderate lesions (dark blue shading) progress to form a single severe lesion (red shading). Concomitantly, a new mild lesion (light blue shading and highlighted by a white asterisk, ∗) appears distal to the existing lesion. (E–G) Total spontaneous swimming distance covered by 5- (E), 6- (F), and 7-dpf (G) WT and cavin1b−/− zebrafish over 1 hr (the same zebrafish were used for each time point). Colored dots indicate different clutches. For both lines, two clutches and n = 24 per group. ns, p > 0.05; ∗∗p ≤ 0.01; ∗∗∗∗p ≤ 0.0001; two-tailed t test. Data are presented as mean ± SD. See Figures S7C and S7D for touch-evoked response assay. |
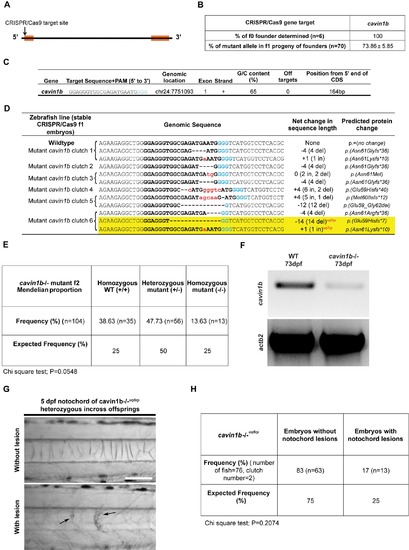
CRISPR/Cas9 generation of cavin1b mutant zebrafish, related to Figure 1: (A) Schematic diagram depicting the position of the CRISPR/Cas9 target site (arrow) at the 5’ end of the cavin1b gene. Two exons (orange boxes) flank an intragenic region. (B) Table showing the percentage of founders determined for cavin1b specific sgRNA-Cas9 injected embryonic mosaics and percentage of mutant alleles identified in three clutches of f1 progeny upon outcrossing f0 cavin1b mosaic line to a corresponding WT line (n=70). (C) Cavin1b target site sequence (PAM sequence in light blue) and corresponding information on genomic location, exon number, strand orientation, G/C content, presence of off targets and position from the 5’ end of the coding region. (D) Indel mutations identified within the CRISPR/Cas9 target site in six stable f1 clutches generated from the outcross of f0 cavin1b mosaics to WT line. The WT sequence is shown at the top with the target site in bold. The PAM sequence is highlighted in blue. Deletions are represented by black dashes and insertions are represented by lower case red letters. The net change in length includes genome modifications that possess both insertions and deletions, with specific indel characteristics stated in parentheses. The predicted protein changes are described in standard nomenclature [S1]. The two mutant cavin1b lines used in this study (cavin1b-/-uq7rp and cavin1b-/-uq8rp) are highlighted in yellow. (E) Frequency of homozygous WT (+/+), heterozygous cavin1b mutant (+/-) and homozygous cavin1b mutant (-/-) zebrafish from a cavin1b+/- incross (n=104 zebrafish from 2 clutches). Allele status was determined using Sanger sequencing on 2 month old zebrafish. Statistical analysis was obtained using a chi square test. (F) RT-PCR gel comparing the level of cavin1b transcript between cavin1b-/- and WT embryos. Actb2 primers were used to indicate loading controls. (G-H) Analysis of a second mutant line [cavin1b-/-uq8rp, see table in (D) for mutation details] also demonstrated the presence of notochord lesions (indicated by arrows) in 5 dpf embryos (G). A heterozygous incross of this line revealed notochord lesions in 17% of embryos, which was not significantly different from expected lesion occurrence (H). Statistical significance was assessed using a chi square test. Bar, 100 μm. |
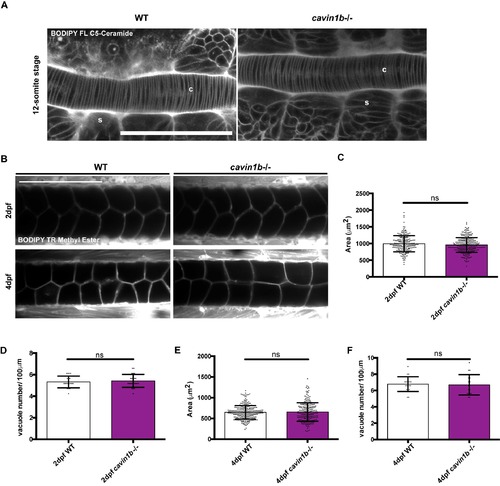
Live chordamesoderm transition and vacuole formation characterization of cavin1b-/- mutant embryos, related to Figure 1: (A) Live imaging of chordamesoderm (c) and adjacent somites (s) in 12-somite stage WT and cavin1b-/- embryos labeled with BODIPY FL C5-Ceramide. Bar, 100 μm. (B) Representative live dorsal images of 2 dpf (top row) and 4 dpf (bottom row) notochord vacuoles of WT and cavin1b-/- embryos labelled with BODIPY TR methyl ester. Bar, 100 μm. (C-F) Quantitation of notochord vacuole area and number per 100 μm length of the notochord for 2 dpf (CD) and 4 dpf (E-F) WT and cavin1b-/- embryos. For cavin1b-/- notochords, images containing lesions were excluded from this quantitation. Number of fish used for 2 dpf: WT=19 and cavin1b-/-=23. Number of fish used for 4 dpf: WT=19 and cavin1b-/-=17. 4 clutches per group. Data are presented as mean±SD. ns=P> 0.05. P values were determined using two-tailed, unpaired t-tests. |
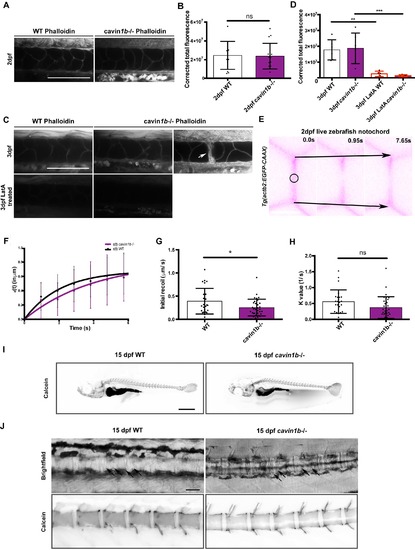
Characterization of actin cortex and vertebra formation of cavin1b-/- zebrafish, related to Figure 2: (A-B) Whole mount staining of 2 dpf WT and cavin1b-/- embryos with Alexa Fluor 594-tagged phalloidin (A). Bar, 100 μm. Corrected total phalloidin fluorescence was quantitated by measuring the corrected integrated density of the notochord (B). Number of fish used: WT=12 and cavin1b-/-=17 (3 clutches per group). (C-D) Whole mount staining of 3 dpf WT and cavin1b-/- embryos with Alexa Fluor 594-tagged phalloidin and corresponding Latrunculin A (LatA) treated controls (C). Notochord lesions in cavin1b-/- embryos show an accumulation of phalloidin stain (arrow). Bar, 100 μm. Corrected total phalloidin fluorescence of 3 dpf WT and cavin1b-/- notochord (with and without LatA treatment) (D). For cavin1b-/- notochords, images containing lesions were not analyzed. Number of fish used: WT=6 and cavin1b-/-=6 (untreated); WT=5 and cavin1b-/-=6 (LatA treated). 2 clutches per group. (E) Measurement of resting cortical tension of notochord cell borders in live 2 dpf WT and cavin1b-/- zebrafish embryos expressing EGFP-CAAX. Representative inverted false color images at different time intervals. The notochord was viewed dorsally and laser ablation was carried out with a Mai Tai multiphoton laser at the indicated area (circle). Recoil of notochord cell junctions measured as vertex separation (black arrows) was tracked for >6 s and analyzed. Bar, 10 μm. (F-H) Recoil measurements [ε(t)] after laser ablation defined as vertex separation over time minus the corresponding vertex distance immediately before ablation (time=0) (F). Instantaneous recoil velocity at time=0 (initial recoil values, G), and K values (ratio between notochord junctional elasticity and viscosity of media, H) were calculated using non-linear regression recoil data in (F) as described in the Method Details. Number of fish used: WT= 9 and cavin1b-/-= 11 from 2 clutches. Total number of ablation sites: WT= 31 and cavin1b-/-= 37; 3-5 ablations per fish. For (B, D, F-H): Data are presented as mean±SD. ns=P> 0.05; * P≤ 0.05; ** P≤ 0.01; *** P≤ 0.001. For (D): P value was determined using an ordinary one-way ANOVA with Tukey’s multicomparison test. For (B, F-H): P values were determined using two-tailed, unpaired t-tests. (I-J) Representative images of calcein-stained 15 dpf WT and cavin1b-/- larvae. Magnified images of calcein-stained spines are shown in (J) with corresponding brightfield images. Arrows indicate inner notochord cells. n=10 fish examined per group. Bars: (I), 1 mm; (J), 100 μm. |
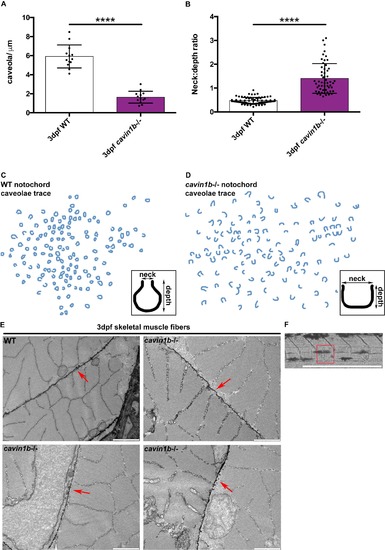
Cavin1b-/- notochord caveola morphology, related to Figures 4 and 5. (A) Number of caveolae per micron of linear length (caveolae/μm) across the notochord plasma membrane of 3 dpf WT and cavin1b-/- embryos. (B) Shape quantitation (calculated as neck to depth ratio) of notochord caveolae from 3 dpf WT and cavin1b-/- embryos. For (A-B): Data are presented as mean±SD. **** P≤ 0.0001. P values were determined using two-tailed, unpaired t-tests. (C-D) Schematic trace of approximately 100 uncoated plasma membrane invaginations from WT (C) and cavin1b-/- (D) notochords derived from electron micrographs of the embryos from (A-B). Insets highlight the ‘average caveola’ shape of WT (C) and cavin1b-/- (D) based on the mean dimensions of the neck and depth of >60 caveolae. For (A-D) Clutch and zebrafish number for both lines=3. (E) Skeletal muscle ultrastructure of representative WT and cavin1b-/- zebrafish. Red arrows point to sarcolemma possessing dense caveolae. Note the lack of observable differences in skeletal muscle ultrastructure and caveola morphology and density between WT and cavin1b-/- zebrafish. n=3 fish for both groups. Bar, 1 μm. (F) Correlative light microscopy image of a section of cavin1b-/- zebrafish notochord containing a lesion. This section was processed for electron microscopy and the lesion (highlighted by boxed area) depicted in Figure 5D. |
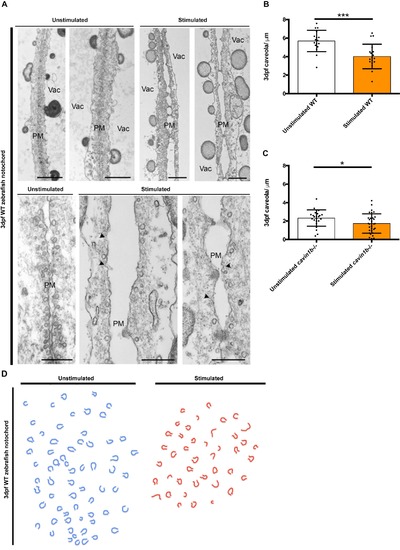
Effects of high intensity electrical stimulation on the ultrastructure of the zebrafish notochord, related to Figure 6: (A) Top: Representative images of the notochord cell-cell junction ultrastructure from unstimulated and electrically stimulated 3 dpf WT zebrafish embryos. Different images represent different embryos. Bar, 2μm. Bottom: Magnified images of the cell-cell junction from unstimulated and stimulated 3 dpf WT zebrafish embryos. Arrowheads point to dysmorphic caveolae. Bar, 500 nm. Vac=vacuole; PM=plasma membrane. (B-C) Number of caveolae per micron of linear length (caveolae/μm) across the notochord plasma membrane of unstimulated and electrically stimulated 3 dpf WT (B) and cavin1b-/- (C) embryos. n=9 WT and n=9 cavin1b-/- from 3 clutches. Data are presented as mean±SD. * P≤ 0.05; *** P≤ 0.001. P value was determined using two-tailed, unpaired t-tests. (D) Schematic trace of all notochord cell surface-connected curved structures observed in images of unstimulated (blue) and stimulated (red) WT zebrafish as represented in (A). |
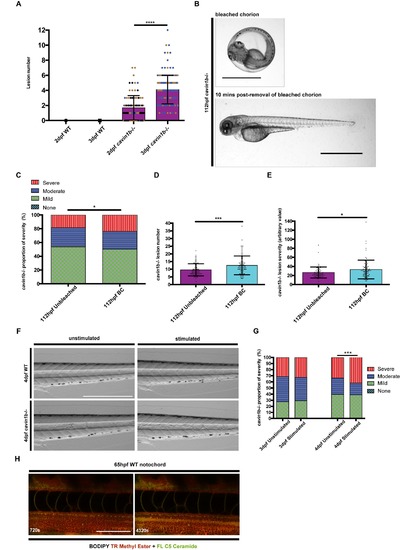
Lesion number in cavin1b-/- zebrafish, chorion bleaching experiment and proportion of severity in electrically stimulated (10 min) cavin1b-/- zebrafish, and prolonged electrical stimulation (76 min) on WT zebrafish, related to Figure 2, 6 and 7: (A) Lesion number in 2 and 3 dpf WT and cavin1b-/- embryos. P value was calculated using a two-tailed, unpaired t-test. 3 clutches per group. Number of individuals used for 2 dpf and 3 dpf WT, and 2 dpf and 3 dpf cavin1b-/-=62, 72, 93, 144 respectively. Dot colors (blue, black, brown) represent different clutches. (B) Representative images of a 112 hpf cavin1b-/- embryo in a bleached chorion (BC) and embryo condition 10 min post-removal of bleached chorion. Bar, 1 mm. (C) Proportion of lesion severity in notochords of live cavin1b-/- embryos fixed in bleached chorion up to 5 dpf (BC) and unbleached cavin1b-/- embryos. There is no measurable lesion in WT controls (fish number=60, clutch number=3). P value was calculated using a chi square test. (D-E) Charts showing comparisons in notochord lesion number and severity index score between cavin1b- /- embryos fixed in bleached chorion up to 5dpf (BC) and unbleached cavin1b-/- embryos. P values were calculated using a two-tailed, unpaired t-test. For (C-E), 3 clutches per group, number of fish used for cavin1b-/- unbleached and BC= 73, 83 respectively. (F) Images of unstimulated and electrically stimulated WT and cavin1b-/- embryos. Electrical stimulation (10 min) was performed at 3 dpf and embryos imaged at 4 dpf. Note the absence of measurable lesions (similar to those observed in corresponding cavin1b-/- images) before and after electrical stimulation in WT zebrafish. Note that skeletal muscle morphology is generally unaffected in both WT and cavin1b-/- embryos. Number of WT fish observed=83. Number of cavin1b-/- fish observed=71. 4 clutches per group. Bar, 0.5 mm. (G) Chart showing the proportion of notochord lesion severity in 3 dpf embryos and corresponding 4 dpf cavin1b-/- embryos after electrical stimulation (10 min) at 3 dpf, and corresponding unstimulated controls. P values were calculated using a chi square test. 4 clutches per group. Number of fish used for both lines>80. (H) Live confocal timelapse images of a 65 hpf WT notochord colabeled with BODIPY TR methyl ester and BODIPY FL C5-Ceramide under prolonged electrical stimulation (approximately 76 min). Frame rate=90 s, time stamp expressed in seconds. Bar, 100 μm. For (A), (C-E), (G), * P≤ 0.05; *** P≤ 0.001; **** P≤ 0.0001. Data are presented as mean±SD. |
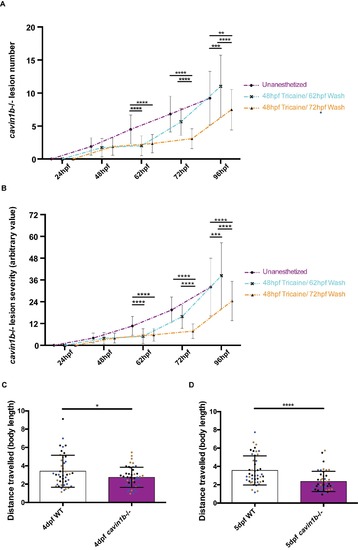
Tricaine washout experiment and touch-evoked response assay for cavin1b-/- embryos, related to Figure 6 and 7: (A-B) Tricaine washout experiments represented by charts indicating cavin1b-/- lesion number (A) and severity index score (B). Cavin1b-/- embryos were either unanesthetized (purple) or anesthetized at 48 hpf and washed into E3 media at 62 hpf (blue) or 72 hpf (orange). P values were calculated using a two-way ANOVA with a posthoc Tukey’s multiple comparison test. 3 clutches per group. Number of fish used for all data groups>59. (C-D) Chart showing the distance travelled by 4 and 5 dpf WT and cavin1b-/- embryos upon touch stimuli in measures of body length. Different clutches are represented by different dot colours (black, brown and blue). 3 clutches per group, number of individuals=45. P values were obtained using a two-tailed, unpaired t-test. For (A-D), * P≤ 0.05; ** P≤ 0.01; *** P≤ 0.001; **** P≤ 0.0001. Data are presented as mean±SD. |