
|
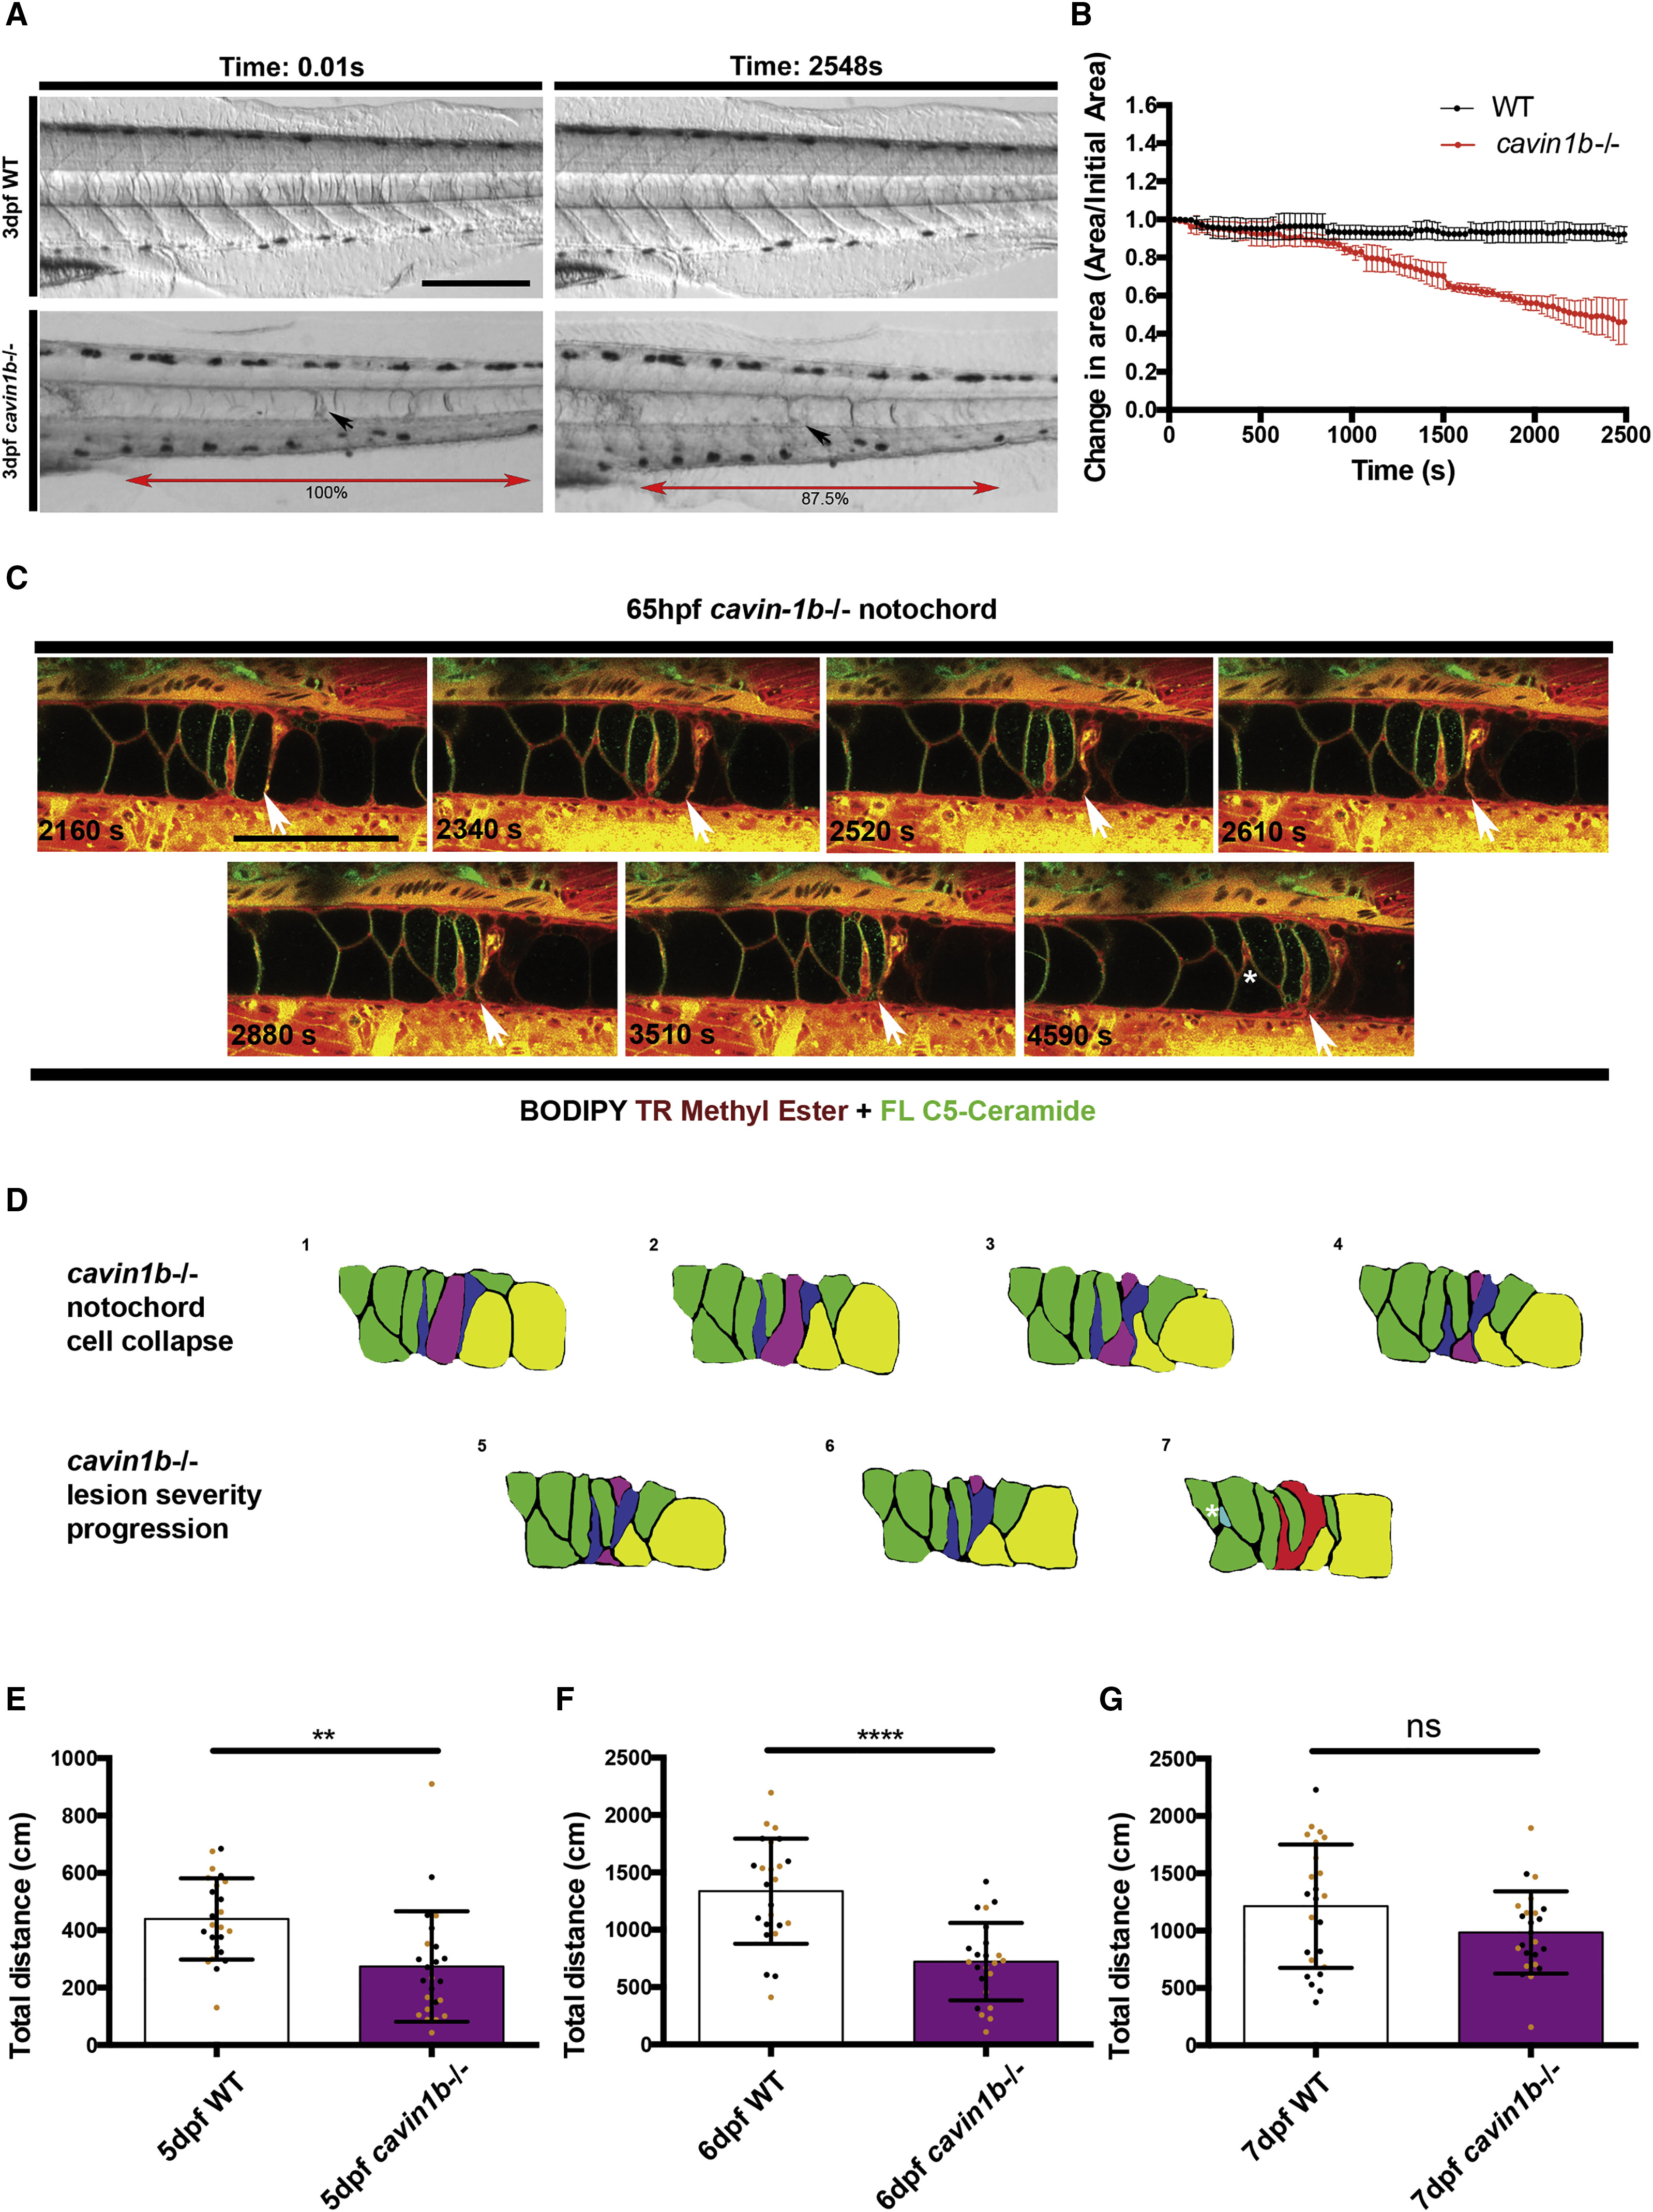
Fig. 7
Live Imaging of cavin1b−/− Notochord Cell Collapse from Prolonged Electrical Stimulation
(A) Video image stills of live 3-dpf cavin1b−/− and WT embryos before and after prolonged electrical stimulation (∼40 min). Note the change in morphology of a lesion (arrow) and the shortening of the body axis of the cavin1b−/− embryo (red double-headed arrow indicates distance between two pigment cells is reduced by 12.5%). The scale bar represents 100 μm.
(B) Change in notochord area spanning six somites under prolonged electrical stimulation (∼40 min). Change in area is expressed as a ratio of initial area. Time interval = 30 s. Clutch size and n per group = 3. Data are presented as mean ± SD.
(C) Live confocal time-lapse images of a 65-hpf cavin1b−/− notochord colabeled with BODIPY TR methyl ester (endomembranes) and BODIPY FL C5-Ceramide (plasma membrane) under prolonged electrical stimulation (~76 min). Frame rate = 90 s; time stamp expressed in seconds. White arrow indicates a collapsing notochord cell region. A white asterisk marks the emergence of a new lesion between neighboring notochord cell borders. The scale bar represents 100 μm. For corresponding WT control, see Figure S6H. See also Movie S1.
(D) Traces of confocal image sequences depicted in (C). Notochord cell membranes are traced. Prolonged electrical stimulation induces cellular collapse (purple-shaded cell), leaving behind membranous debris. Neighboring cells (shaded green) change shape to accommodate these morphological changes (prominent shape changes highlighted in yellow-shaded cells). During this sequence, two moderate lesions (dark blue shading) progress to form a single severe lesion (red shading). Concomitantly, a new mild lesion (light blue shading and highlighted by a white asterisk, ∗) appears distal to the existing lesion.
(E–G) Total spontaneous swimming distance covered by 5- (E), 6- (F), and 7-dpf (G) WT and cavin1b−/− zebrafish over 1 hr (the same zebrafish were used for each time point). Colored dots indicate different clutches. For both lines, two clutches and n = 24 per group. ns, p > 0.05; ∗∗p ≤ 0.01; ∗∗∗∗p ≤ 0.0001; two-tailed t test. Data are presented as mean ± SD. See Figures S7C and S7D for touch-evoked response assay.