
|
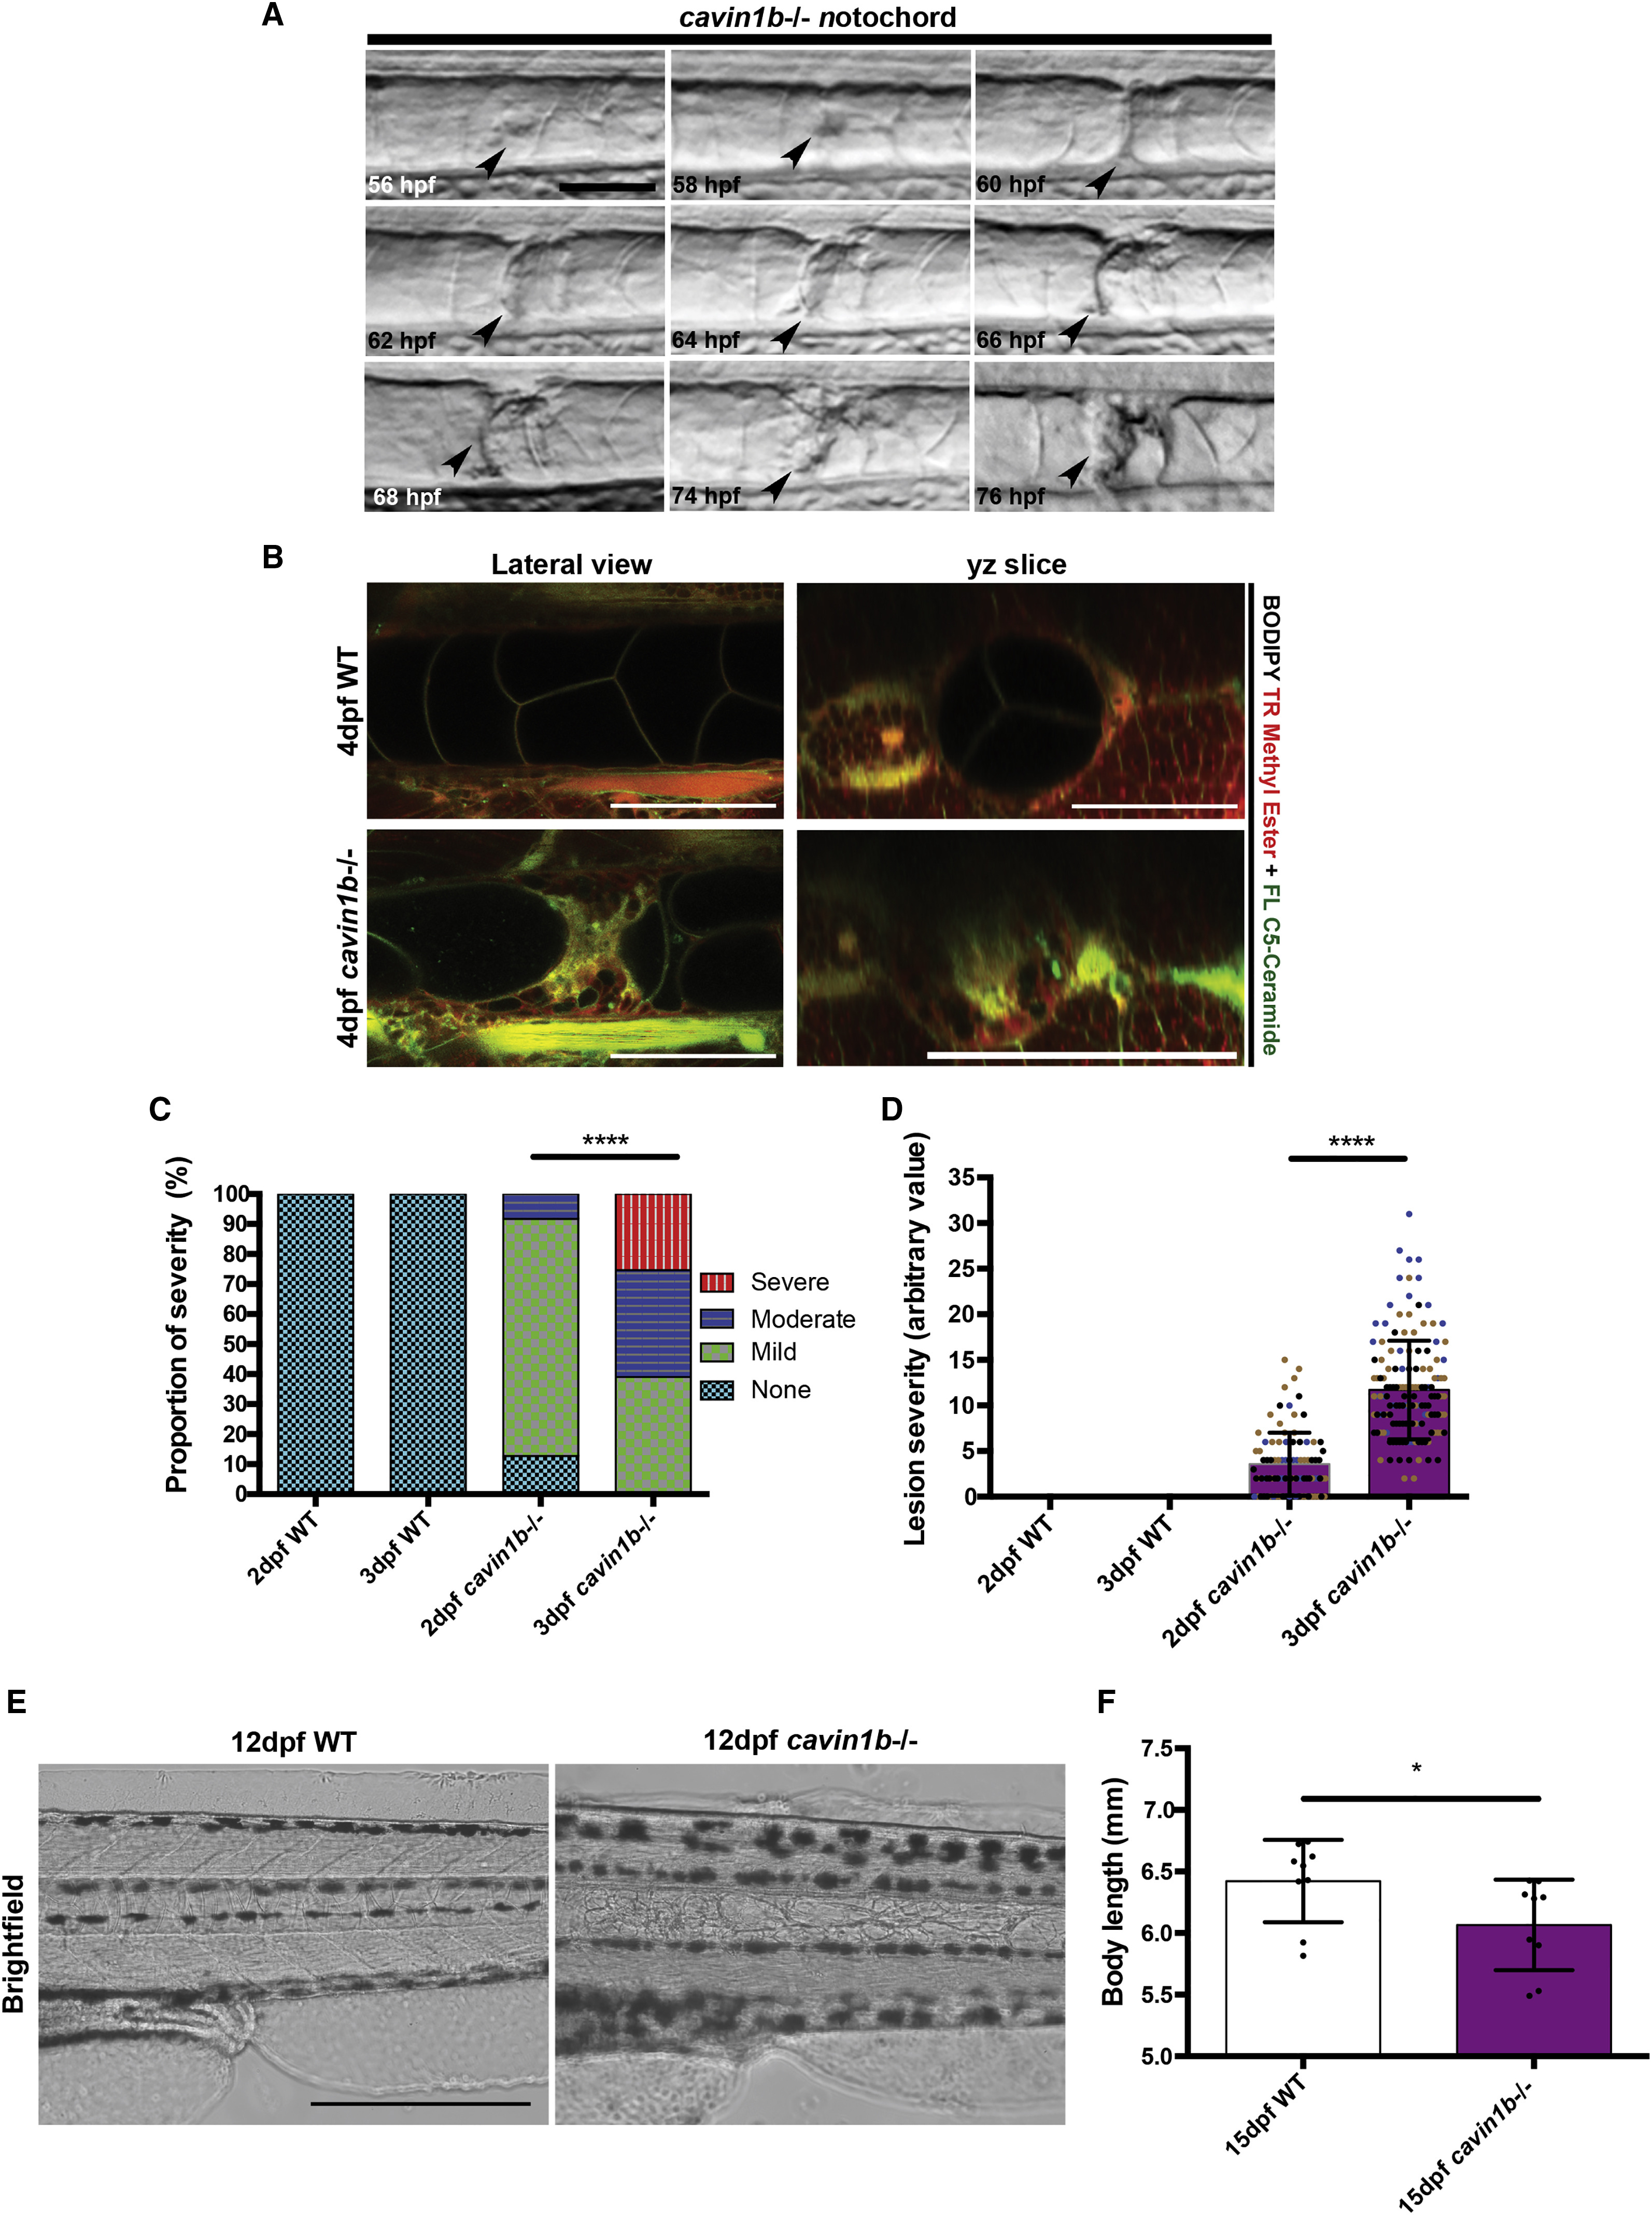
Fig. 2
Notochord Lesions Manifest in Varying Severity and Number
(A) Initiation of lesion formation in a live cavin1b−/− embryo from 56 hpf to 76 hpf (arrowhead marks lesion). The scale bar represents 50 μm.
(B) Accumulation of intravital markers of plasma membrane (green, BODIPY FL C5-Ceramide) and endomembranes (red, BODIPY TR methyl ester). Live confocal images of 4-dpf WT and cavin1b−/− notochords are shown. Lateral and transverse images are taken from the same z stack. The scale bar represents 100 μm. For characterization of underlying actin cortex, including actin status in lesions and cortical tension, see Figures S3A–S3H.
(C) Proportion of lesions classed as mild, moderate, or severe between 2 and 3 dpf in WT and cavin1b−/− embryos. ∗∗∗∗p ≤ 0.0001; chi square test.
(D) Progression of individual phenotypic severity between 2 and 3 dpf using the “severity index,” a function of lesion number and lesion severity in WT and cavin1b−/− embryos. Colored dots indicate different clutches. ∗∗∗∗p ≤ 0.0001; two-tailed t test.
For (C) and (D), 2 dpf: n = 62 (WT) and n = 72 (mutant); 3 dpf: n = 93 (WT) and n = 144 (mutant); three clutches per group. Data are presented as mean ± SD. For number of lesions per fish, see Figure S6A.
(E) Live images of late-stage (12 dpf) larval notochords. Note the irregular cellular morphology in cavin1b−/− compared to WT. The scale bar represents 400 μm.
(F) Body length of 15-dpf WT and cavin1b−/− larvae (n = 9; clutch = 2 each group). ∗p ≤ 0.05; two-tailed t test. Data are presented as mean ± SD. See Figures S3I and S3J for calcein staining of 15-dpf embryos.