
Fig. 6
- ID
- ZDB-FIG-170815-19
- Publication
- Lim et al., 2017 - Caveolae Protect Notochord Cells against Catastrophic Mechanical Failure during Development
- Other Figures
- All Figure Page
- Back to All Figure Page
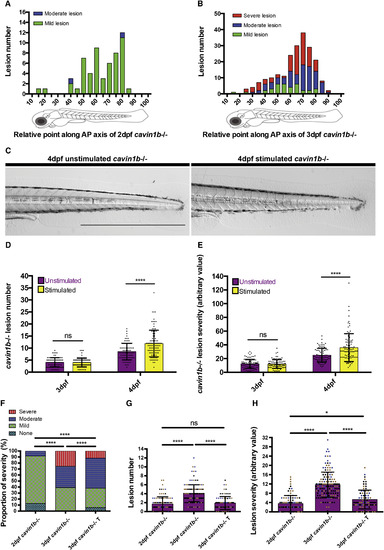
Notochord Lesion Formation and Severity Is Dependent on Locomotion (A and B) Frequency of mild, moderate, and severe lesions along the anterior-posterior (AP) axis of 2-dpf (A) and 3-dpf (B) cavin1b−/− embryos. No severe lesions were observed in 2-dpf embryos. Two clutches per group are shown; n = 30 (2 dpf) and n = 44 (3 dpf). (C) Live image of a 4-dpf cavin1b−/− embryo after electrical stimulation (10 min) at 3 dpf and corresponding unstimulated cavin1b−/− control. Note that there are no skeletal muscle perturbations upon stimulation. The scale bar represents 1 mm. Images of WT controls after electrical stimulation are shown in Figure S6F. For the effects of electrical stimulation on the surface ultrastructure, see Figures S5A–S5D. (D and E) Notochord lesion number (D) and severity index (E) for 3-dpf embryos and corresponding 4-dpf cavin1b−/− embryos after electrical stimulation (10 min) at 3 dpf and corresponding unstimulated controls. ns, p > 0.05; ∗∗∗∗p ≤ 0.0001; two-way ANOVA with Tukey’s multiple-comparison test. Data are presented as mean ± SD; four clutches per group; n per group > 80. For proportion of notochord lesion severity, see Figure S6G. For a different mechanical loading experiment (chorion bleaching), see Figures S6B–S6E. (F) Proportion of lesion severity in notochords of 3-dpf cavin1b−/− embryos following anesthesia in tricaine (T) for 24 hr compared to 2- and 3-dpf unanesthetized cavin1b−/− embryos. ∗∗∗∗p ≤ 0.0001; chi square test. (G and H) Lesion number (G) and severity index (H) in 3-dpf cavin1b−/− embryos following anesthesia in T for 24 hr compared to 2- and 3-dpf unanesthetized cavin1b−/− embryos. ns, p > 0.05; ∗p ≤ 0.05; ∗∗∗∗p ≤ 0.0001; one-way ANOVA with Tukey’s multiple-comparison test. Data are presented as mean ± SD. For (F)–(H), n per group = 93 (2 dpf), 144 (3 dpf), and 83 (3 dpf with tricaine). Three clutches per group are shown. For tricaine washout experiments, refer to Figures S7A and S7B. |
| Fish: | |
|---|---|
| Condition: | |
| Observed In: | |
| Stage Range: | Long-pec to Day 4 |