
Fig. S4
- ID
- ZDB-FIG-170815-24
- Publication
- Lim et al., 2017 - Caveolae Protect Notochord Cells against Catastrophic Mechanical Failure during Development
- Other Figures
- All Figure Page
- Back to All Figure Page
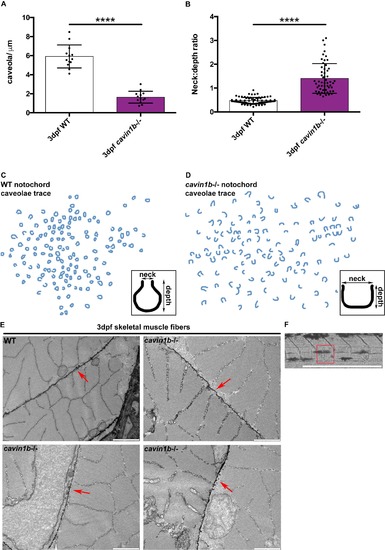
Cavin1b-/- notochord caveola morphology, related to Figures 4 and 5. (A) Number of caveolae per micron of linear length (caveolae/μm) across the notochord plasma membrane of 3 dpf WT and cavin1b-/- embryos. (B) Shape quantitation (calculated as neck to depth ratio) of notochord caveolae from 3 dpf WT and cavin1b-/- embryos. For (A-B): Data are presented as mean±SD. **** P≤ 0.0001. P values were determined using two-tailed, unpaired t-tests. (C-D) Schematic trace of approximately 100 uncoated plasma membrane invaginations from WT (C) and cavin1b-/- (D) notochords derived from electron micrographs of the embryos from (A-B). Insets highlight the ‘average caveola’ shape of WT (C) and cavin1b-/- (D) based on the mean dimensions of the neck and depth of >60 caveolae. For (A-D) Clutch and zebrafish number for both lines=3. (E) Skeletal muscle ultrastructure of representative WT and cavin1b-/- zebrafish. Red arrows point to sarcolemma possessing dense caveolae. Note the lack of observable differences in skeletal muscle ultrastructure and caveola morphology and density between WT and cavin1b-/- zebrafish. n=3 fish for both groups. Bar, 1 μm. (F) Correlative light microscopy image of a section of cavin1b-/- zebrafish notochord containing a lesion. This section was processed for electron microscopy and the lesion (highlighted by boxed area) depicted in Figure 5D. |