
|
Fig. S3
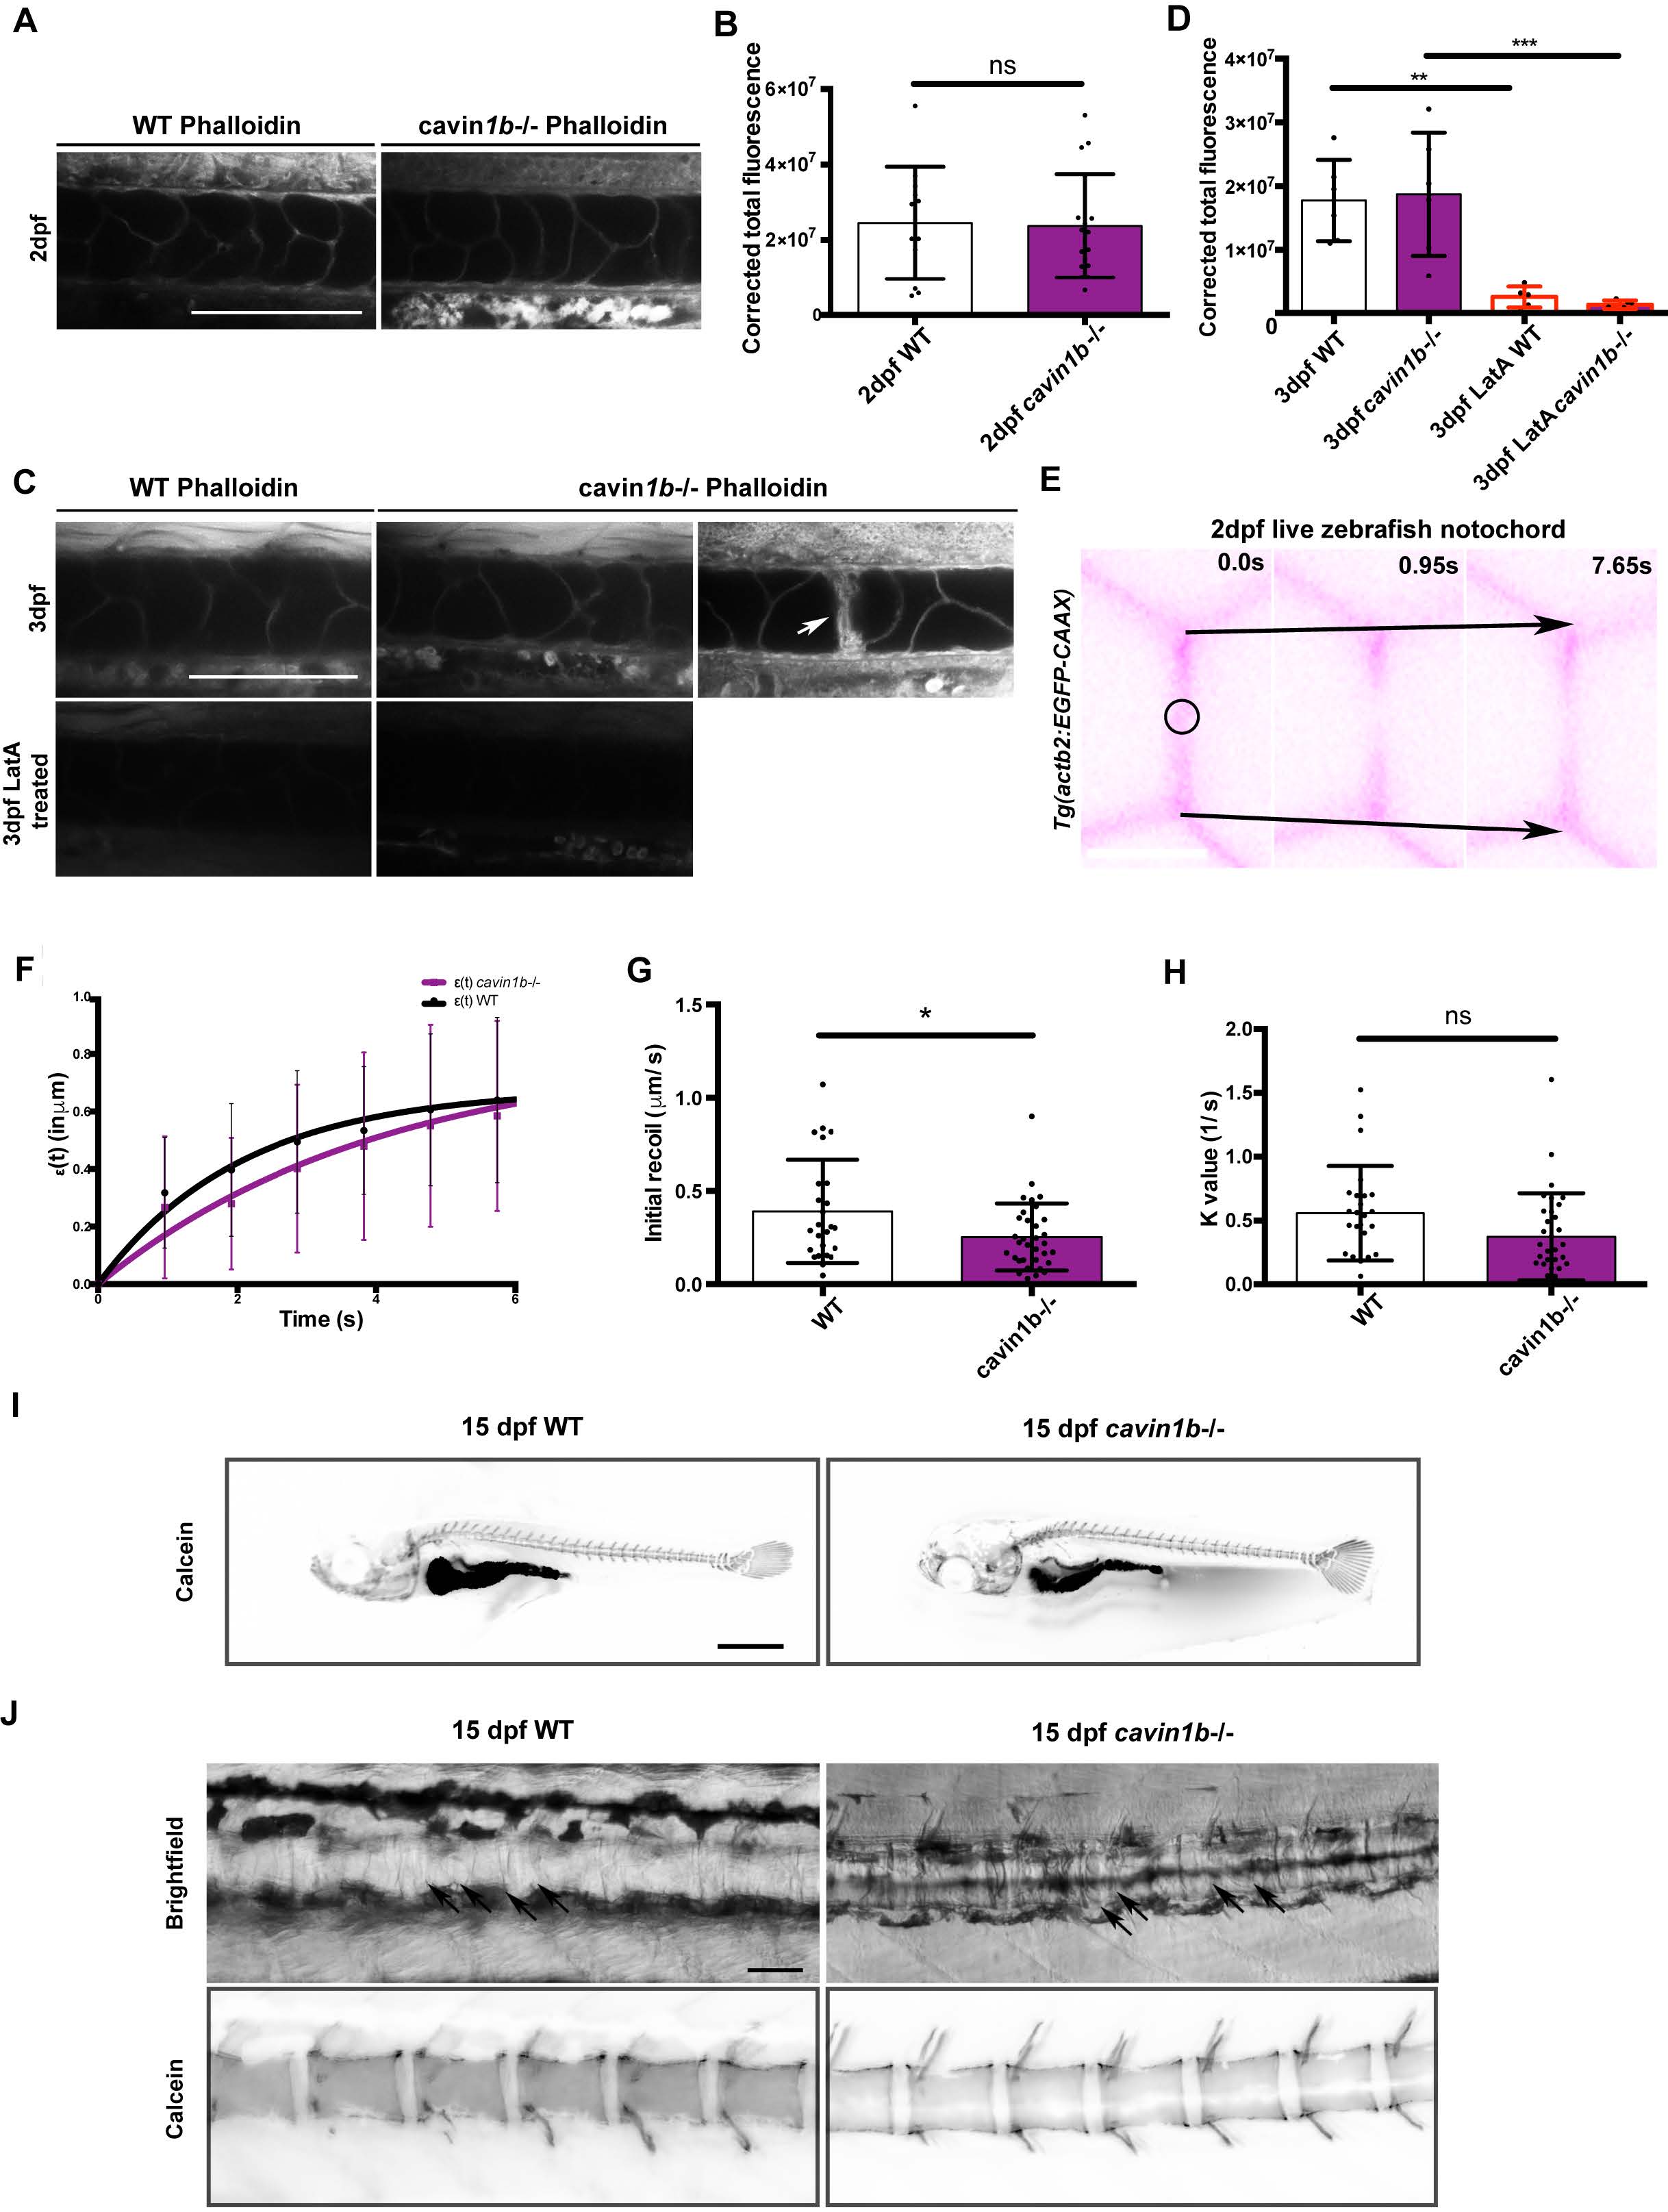
Characterization of actin cortex and vertebra formation of cavin1b-/- zebrafish, related to Figure 2:
(A-B) Whole mount staining of 2 dpf WT and cavin1b-/- embryos with Alexa Fluor 594-tagged phalloidin (A). Bar, 100 μm. Corrected total phalloidin fluorescence was quantitated by measuring the corrected integrated density of the notochord (B). Number of fish used: WT=12 and cavin1b-/-=17 (3 clutches per group).
(C-D) Whole mount staining of 3 dpf WT and cavin1b-/- embryos with Alexa Fluor 594-tagged phalloidin and corresponding Latrunculin A (LatA) treated controls (C). Notochord lesions in cavin1b-/- embryos show an accumulation of phalloidin stain (arrow). Bar, 100 μm. Corrected total phalloidin fluorescence of 3 dpf WT and cavin1b-/- notochord (with and without LatA treatment) (D). For cavin1b-/- notochords, images containing lesions were not analyzed. Number of fish used: WT=6 and cavin1b-/-=6 (untreated); WT=5 and cavin1b-/-=6 (LatA treated). 2 clutches per group.
(E) Measurement of resting cortical tension of notochord cell borders in live 2 dpf WT and cavin1b-/- zebrafish embryos expressing EGFP-CAAX. Representative inverted false color images at different time intervals. The notochord was viewed dorsally and laser ablation was carried out with a Mai Tai multiphoton laser at the indicated area (circle). Recoil of notochord cell junctions measured as vertex separation (black arrows) was tracked for >6 s and analyzed. Bar, 10 μm.
(F-H) Recoil measurements [ε(t)] after laser ablation defined as vertex separation over time minus the corresponding vertex distance immediately before ablation (time=0) (F). Instantaneous recoil velocity at time=0 (initial recoil values, G), and K values (ratio between notochord junctional elasticity and viscosity of media, H) were calculated using non-linear regression recoil data in (F) as described in the Method Details. Number of fish used: WT= 9 and cavin1b-/-= 11 from 2 clutches. Total number of ablation sites: WT= 31 and cavin1b-/-= 37; 3-5 ablations per fish.
For (B, D, F-H): Data are presented as mean±SD. ns=P> 0.05; * P≤ 0.05; ** P≤ 0.01; *** P≤ 0.001. For (D): P value was determined using an ordinary one-way ANOVA with Tukey’s multicomparison test. For (B, F-H): P values were determined using two-tailed, unpaired t-tests.
(I-J) Representative images of calcein-stained 15 dpf WT and cavin1b-/- larvae. Magnified images of calcein-stained spines are shown in (J) with corresponding brightfield images. Arrows indicate inner notochord cells. n=10 fish examined per group. Bars: (I), 1 mm; (J), 100 μm.