
|
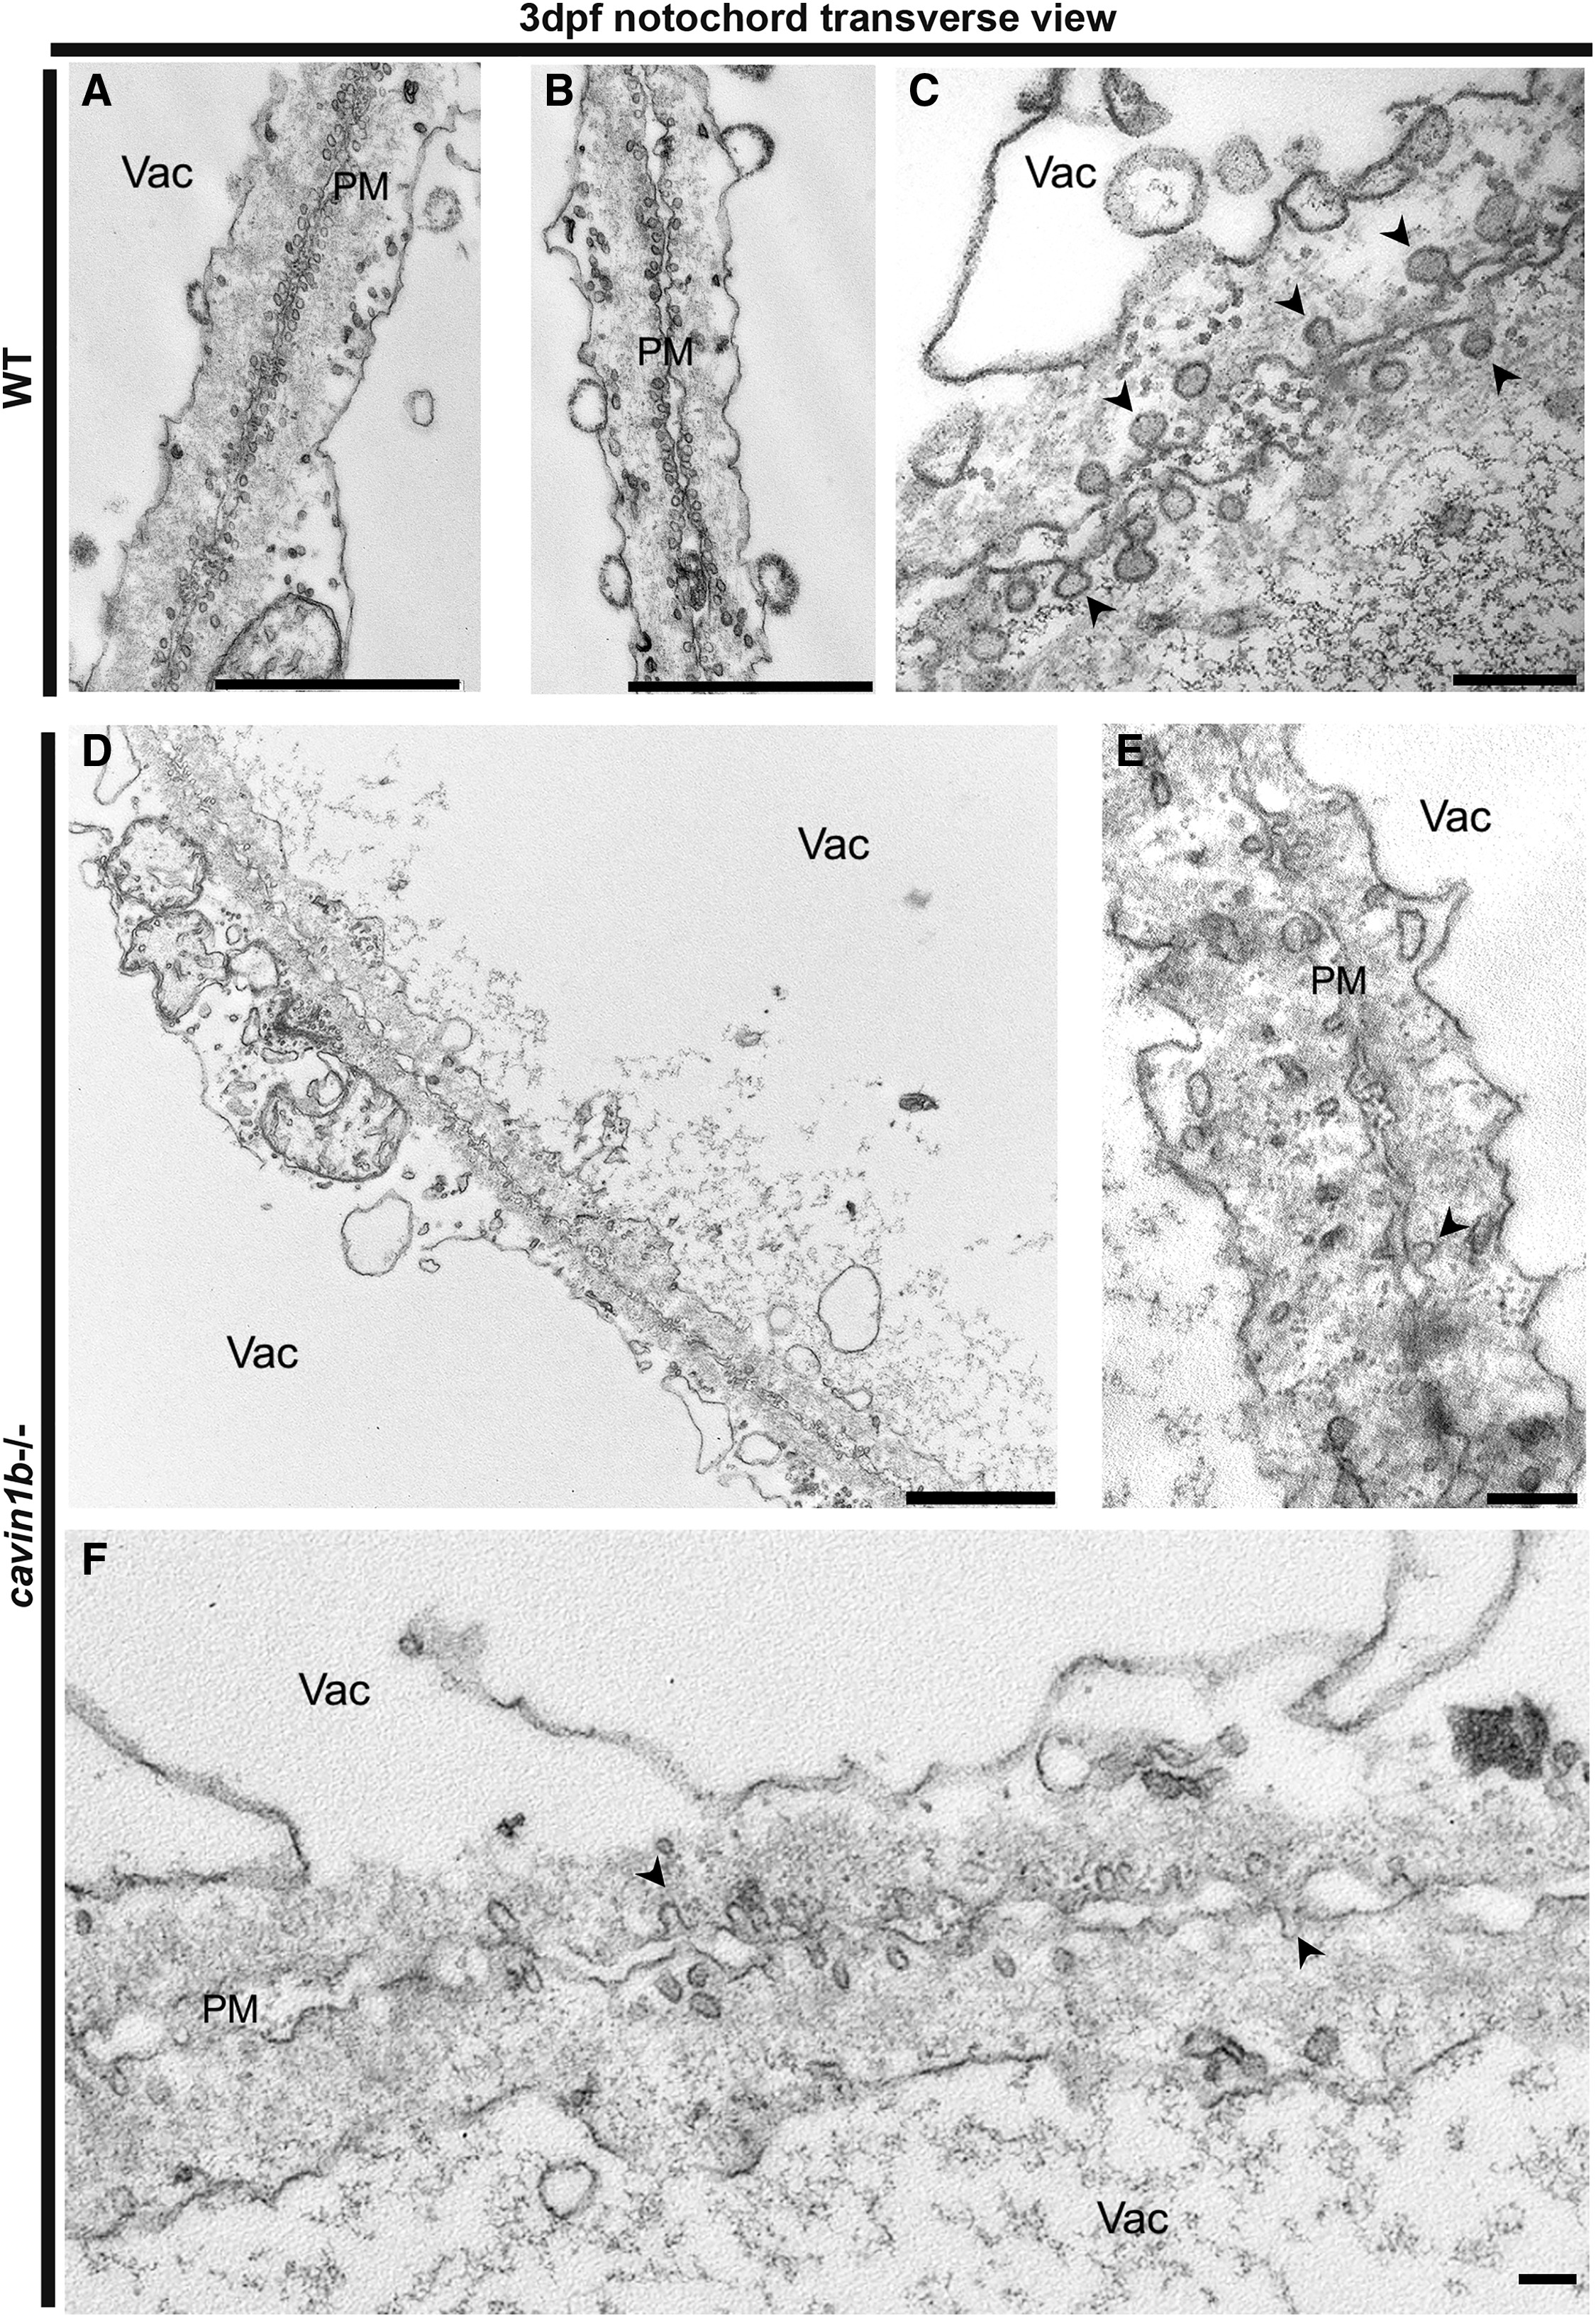
Fig. 4
Transverse Ultrastructure of 3-dpf cavin1b−/− Notochords
Ultrastructure of the junction between two neighboring notochord cells in non-lesion sites from WT (A–C) and cavin1b−/− (D–F) zebrafish embryos. Higher magnification in (C) shows dense caveolae in the membranes of adjacent cells in WT. Higher magnification in (E) and (F) highlights loss of caveola density in the septa between cavin1b−/− cells. Black arrowheads indicate caveolae. Note the differences in morphology between 3-dpf WT and cavin1b−/− caveolae. For quantitation of caveola number and shape description, refer to Figures S4A–S4D. PM, plasma membrane; Vac, vacuole. The scale bars represent (A, B, and D–F) 2 μm and (C) 200 nm. For ultrastructure of skeletal muscle, refer to Figure S4E.