
|
Fig. S2
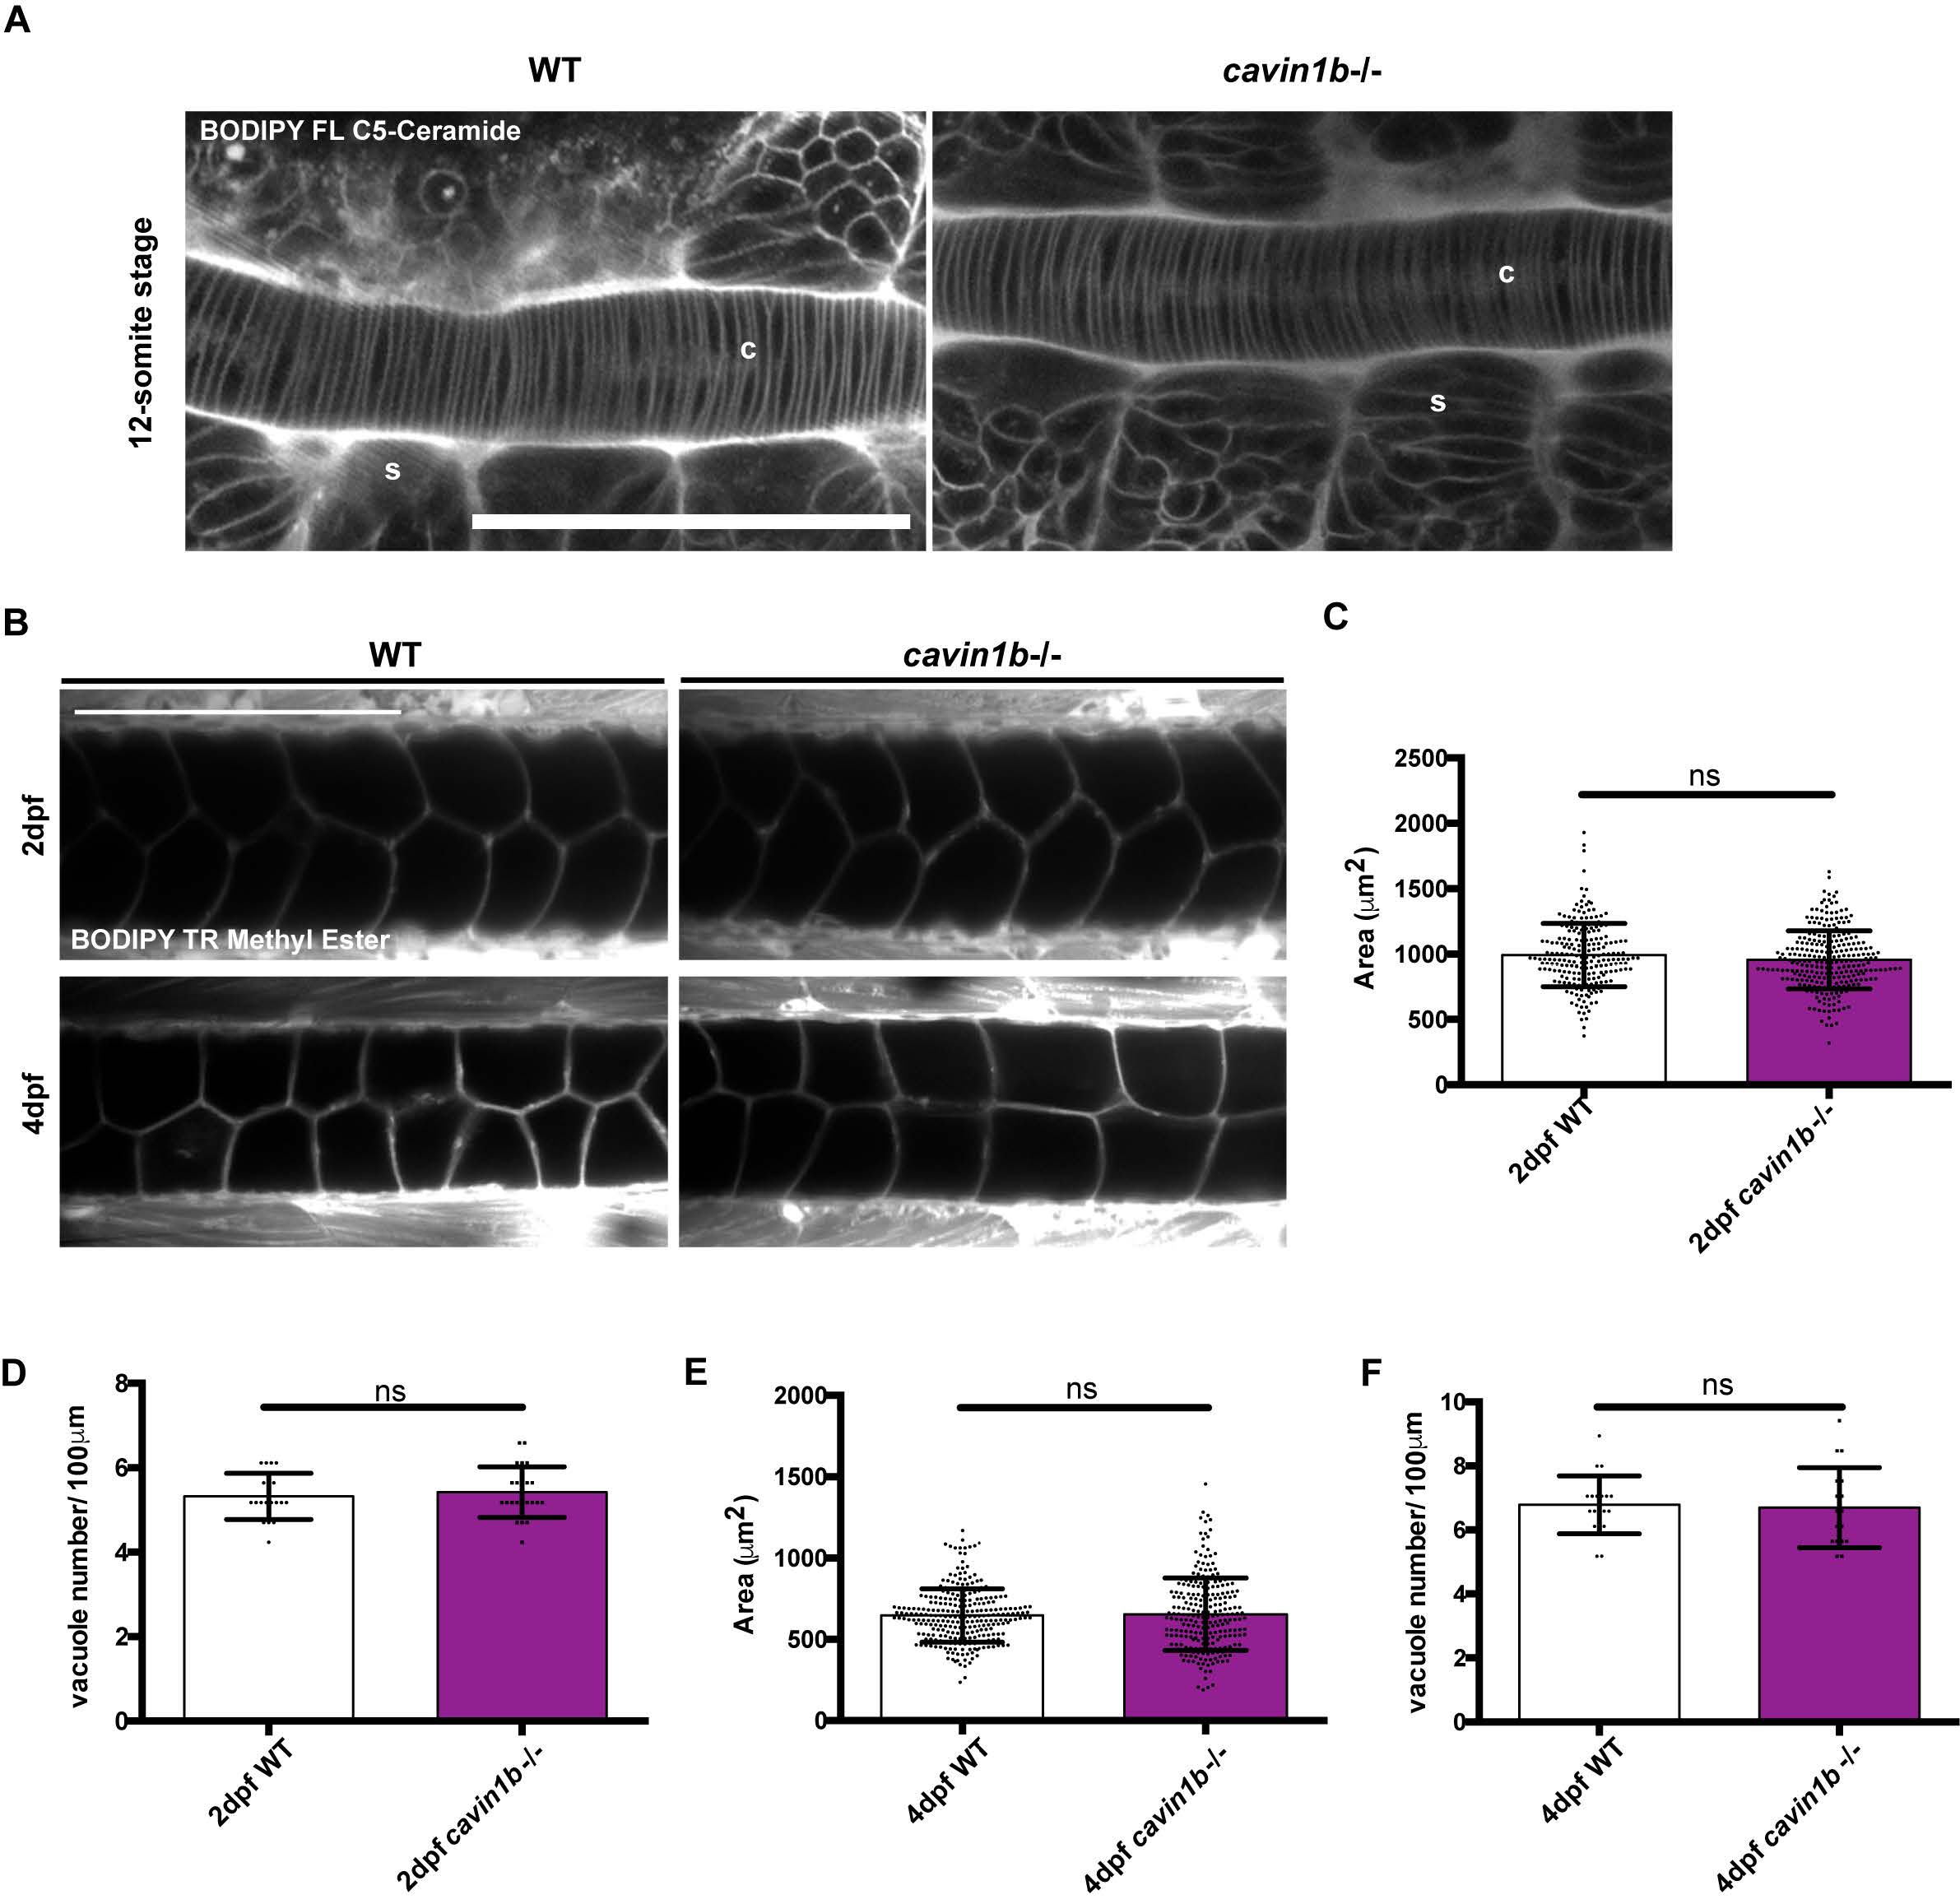
Live chordamesoderm transition and vacuole formation characterization of cavin1b-/- mutant embryos, related to Figure 1:
(A) Live imaging of chordamesoderm (c) and adjacent somites (s) in 12-somite stage WT and cavin1b-/- embryos labeled with BODIPY FL C5-Ceramide. Bar, 100 μm.
(B) Representative live dorsal images of 2 dpf (top row) and 4 dpf (bottom row) notochord vacuoles of WT and cavin1b-/- embryos labelled with BODIPY TR methyl ester. Bar, 100 μm.
(C-F) Quantitation of notochord vacuole area and number per 100 μm length of the notochord for 2 dpf (CD) and 4 dpf (E-F) WT and cavin1b-/- embryos. For cavin1b-/- notochords, images containing lesions were excluded from this quantitation. Number of fish used for 2 dpf: WT=19 and cavin1b-/-=23. Number of fish used for 4 dpf: WT=19 and cavin1b-/-=17. 4 clutches per group. Data are presented as mean±SD. ns=P> 0.05. P values were determined using two-tailed, unpaired t-tests.