
|
Fig. S1
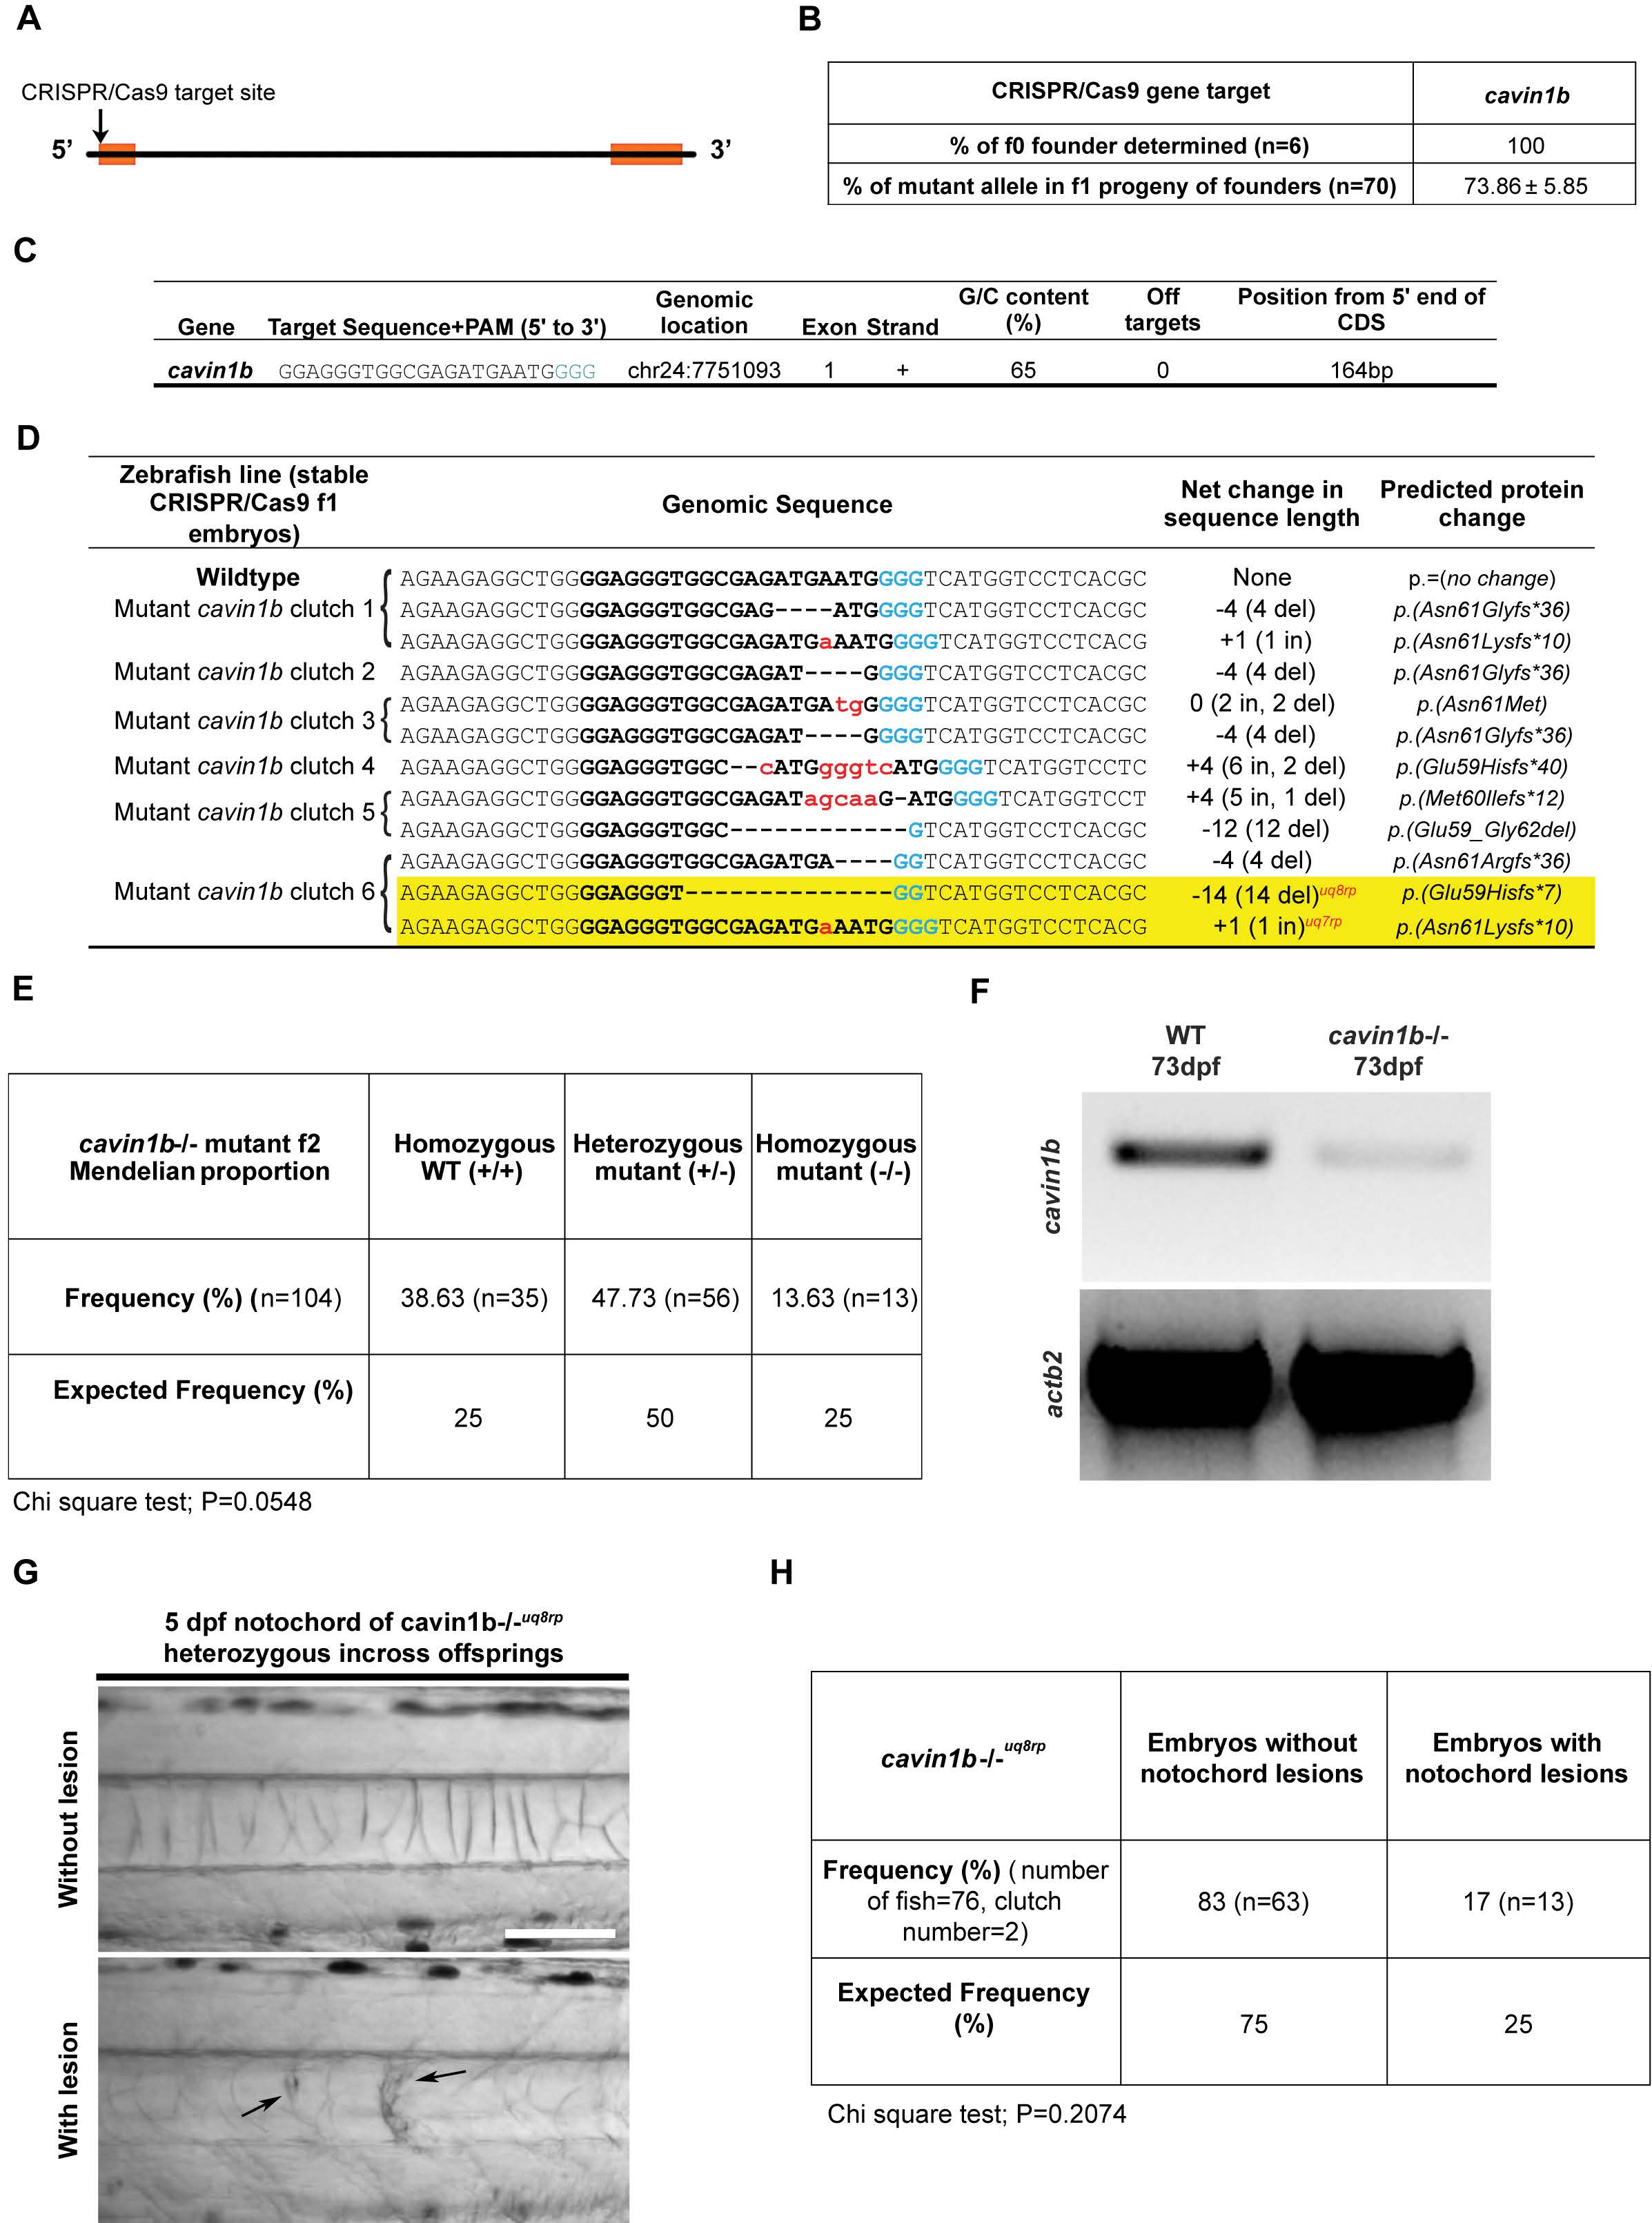
CRISPR/Cas9 generation of cavin1b mutant zebrafish, related to Figure 1:
(A) Schematic diagram depicting the position of the CRISPR/Cas9 target site (arrow) at the 5’ end of the cavin1b gene. Two exons (orange boxes) flank an intragenic region.
(B) Table showing the percentage of founders determined for cavin1b specific sgRNA-Cas9 injected embryonic mosaics and percentage of mutant alleles identified in three clutches of f1 progeny upon outcrossing f0 cavin1b mosaic line to a corresponding WT line (n=70).
(C) Cavin1b target site sequence (PAM sequence in light blue) and corresponding information on genomic location, exon number, strand orientation, G/C content, presence of off targets and position from the 5’ end of the coding region.
(D) Indel mutations identified within the CRISPR/Cas9 target site in six stable f1 clutches generated from the outcross of f0 cavin1b mosaics to WT line. The WT sequence is shown at the top with the target site in bold. The PAM sequence is highlighted in blue. Deletions are represented by black dashes and insertions are represented by lower case red letters. The net change in length includes genome modifications that possess both insertions and deletions, with specific indel characteristics stated in parentheses. The predicted protein changes are described in standard nomenclature [S1]. The two mutant cavin1b lines used in this study (cavin1b-/-uq7rp and cavin1b-/-uq8rp) are highlighted in yellow.
(E) Frequency of homozygous WT (+/+), heterozygous cavin1b mutant (+/-) and homozygous cavin1b mutant (-/-) zebrafish from a cavin1b+/- incross (n=104 zebrafish from 2 clutches). Allele status was determined using Sanger sequencing on 2 month old zebrafish. Statistical analysis was obtained using a chi square test.
(F) RT-PCR gel comparing the level of cavin1b transcript between cavin1b-/- and WT embryos. Actb2 primers were used to indicate loading controls.
(G-H) Analysis of a second mutant line [cavin1b-/-uq8rp, see table in (D) for mutation details] also demonstrated the presence of notochord lesions (indicated by arrows) in 5 dpf embryos (G). A heterozygous incross of this line revealed notochord lesions in 17% of embryos, which was not significantly different from expected lesion occurrence (H). Statistical significance was assessed using a chi square test. Bar, 100 μm.