
|
Fig. S5
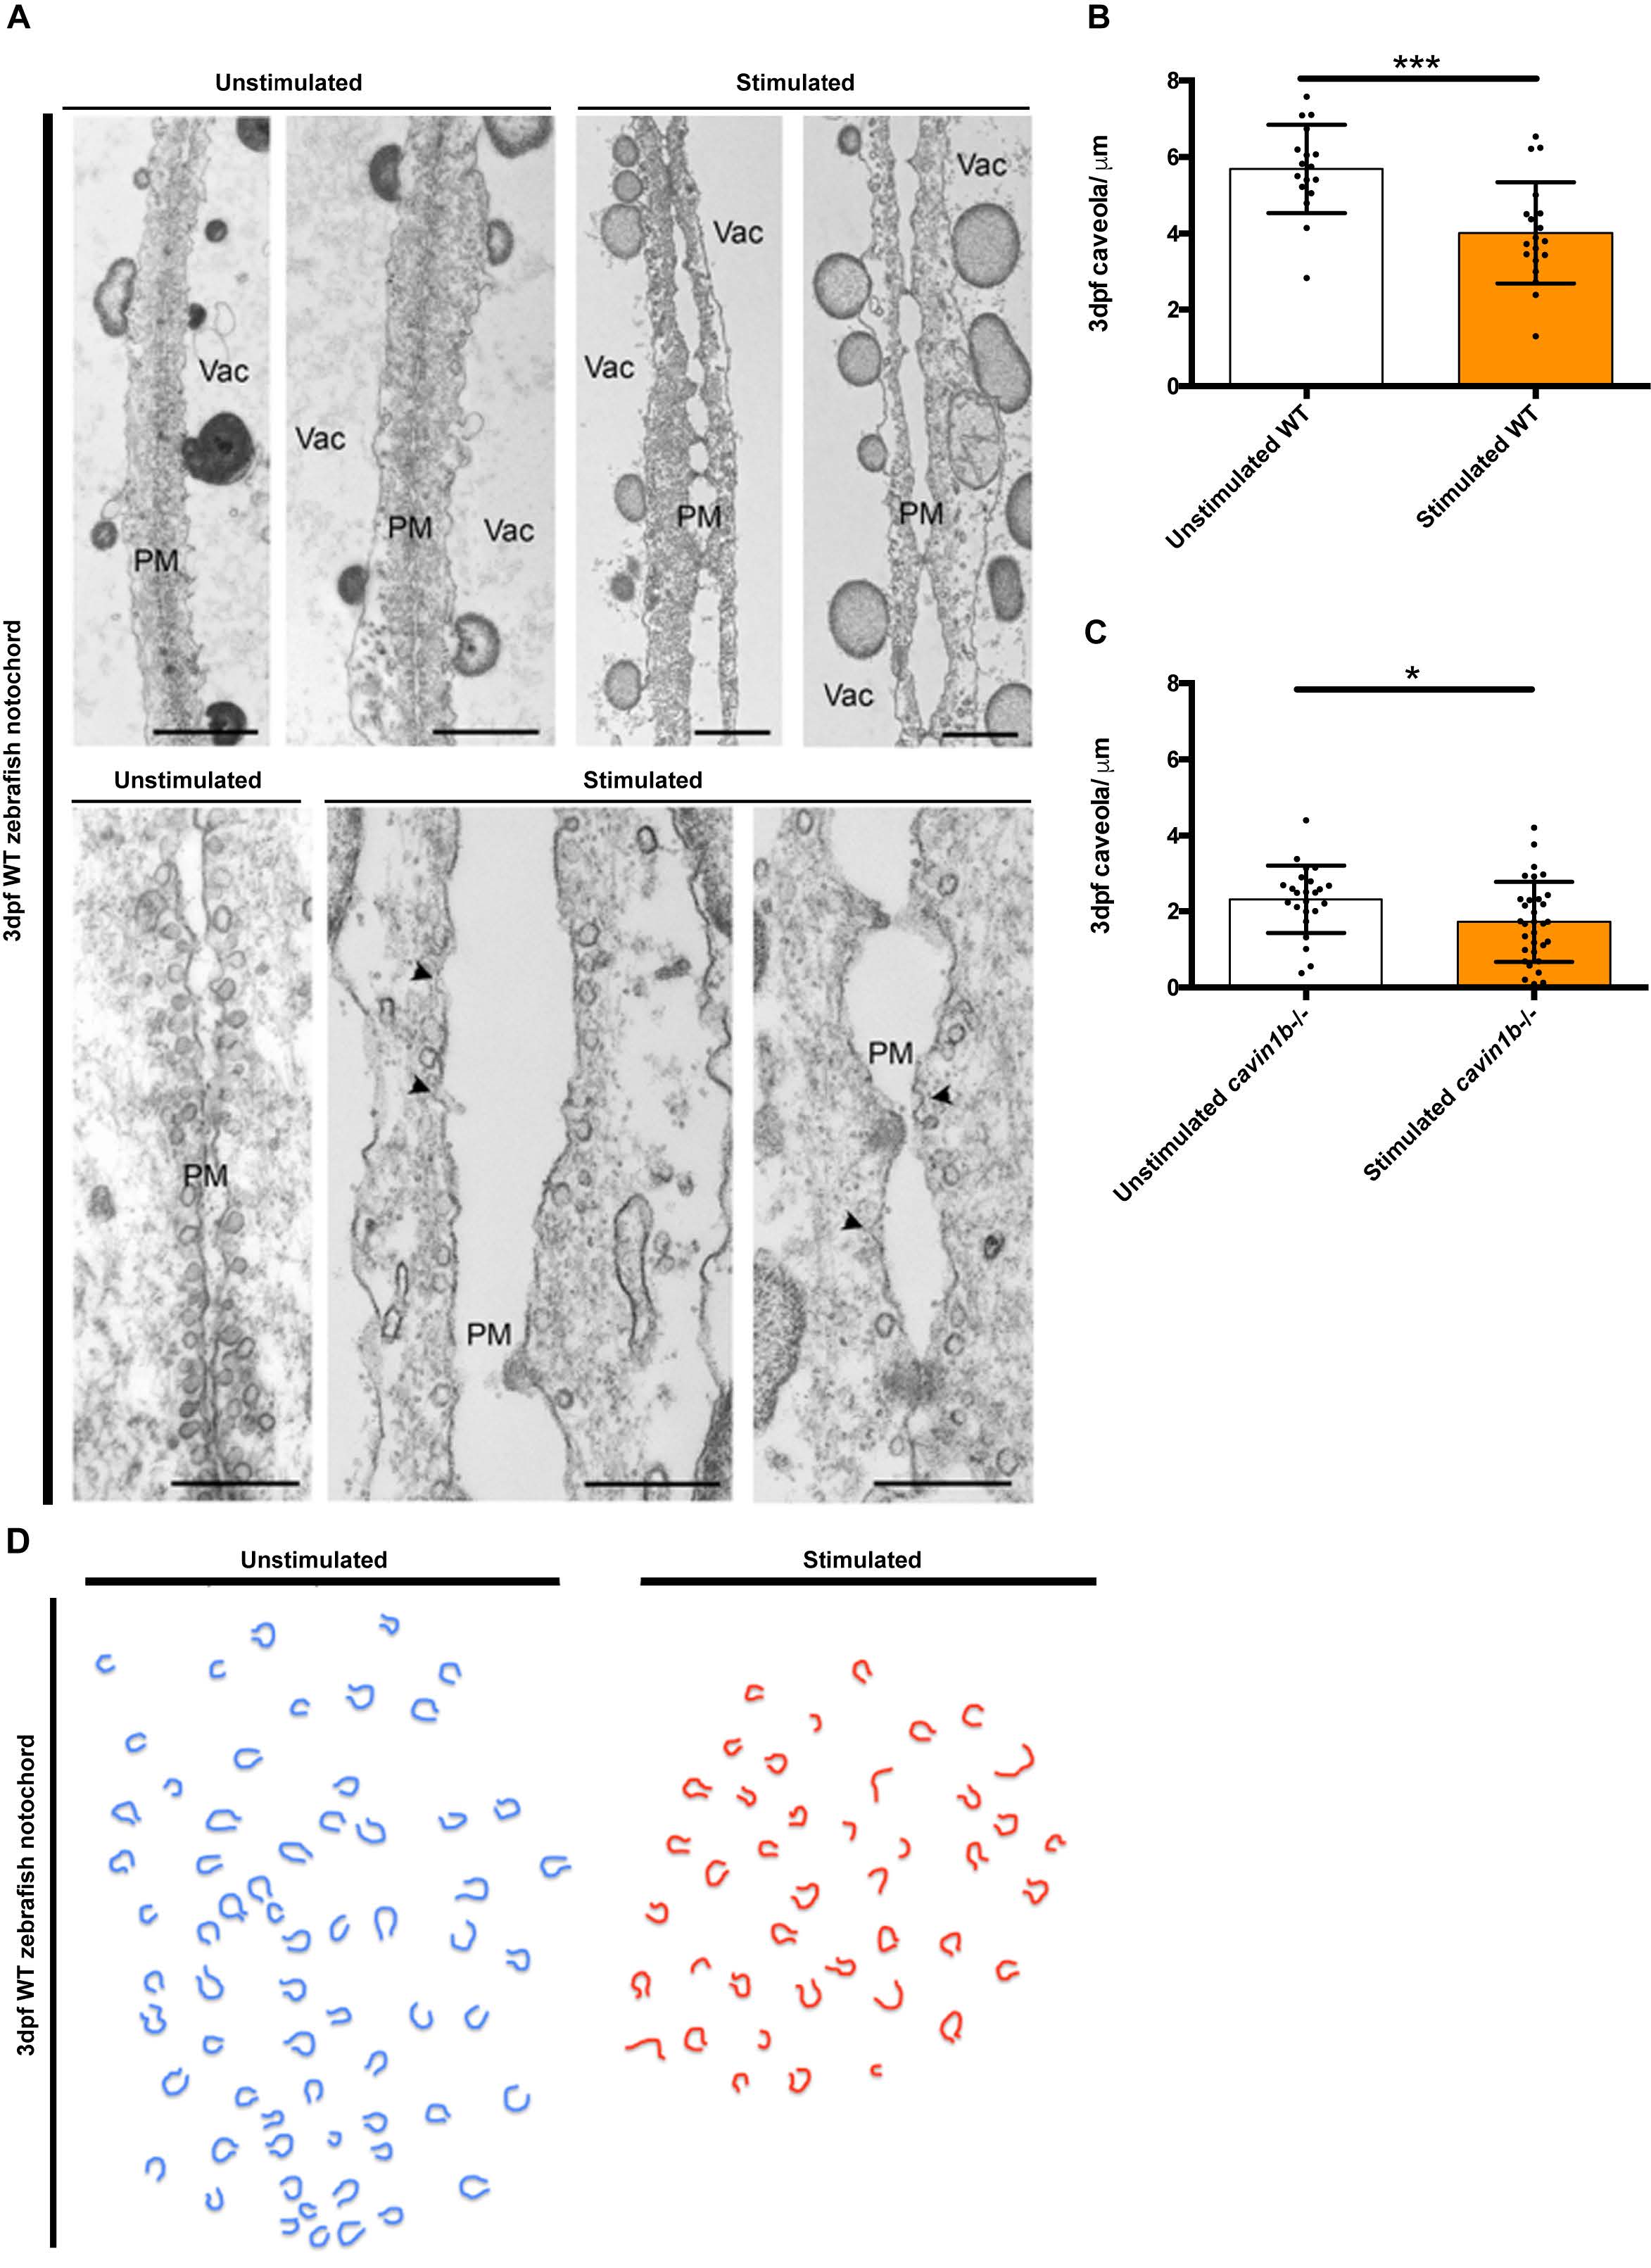
Effects of high intensity electrical stimulation on the ultrastructure of the zebrafish notochord, related to Figure 6:
(A) Top: Representative images of the notochord cell-cell junction ultrastructure from unstimulated and electrically stimulated 3 dpf WT zebrafish embryos. Different images represent different embryos. Bar, 2μm. Bottom: Magnified images of the cell-cell junction from unstimulated and stimulated 3 dpf WT zebrafish embryos. Arrowheads point to dysmorphic caveolae. Bar, 500 nm. Vac=vacuole; PM=plasma membrane.
(B-C) Number of caveolae per micron of linear length (caveolae/μm) across the notochord plasma membrane of unstimulated and electrically stimulated 3 dpf WT (B) and cavin1b-/- (C) embryos. n=9 WT and n=9 cavin1b-/- from 3 clutches. Data are presented as mean±SD. * P≤ 0.05; *** P≤ 0.001. P value was determined using two-tailed, unpaired t-tests.
(D) Schematic trace of all notochord cell surface-connected curved structures observed in images of unstimulated (blue) and stimulated (red) WT zebrafish as represented in (A).