
|
Fig. S6
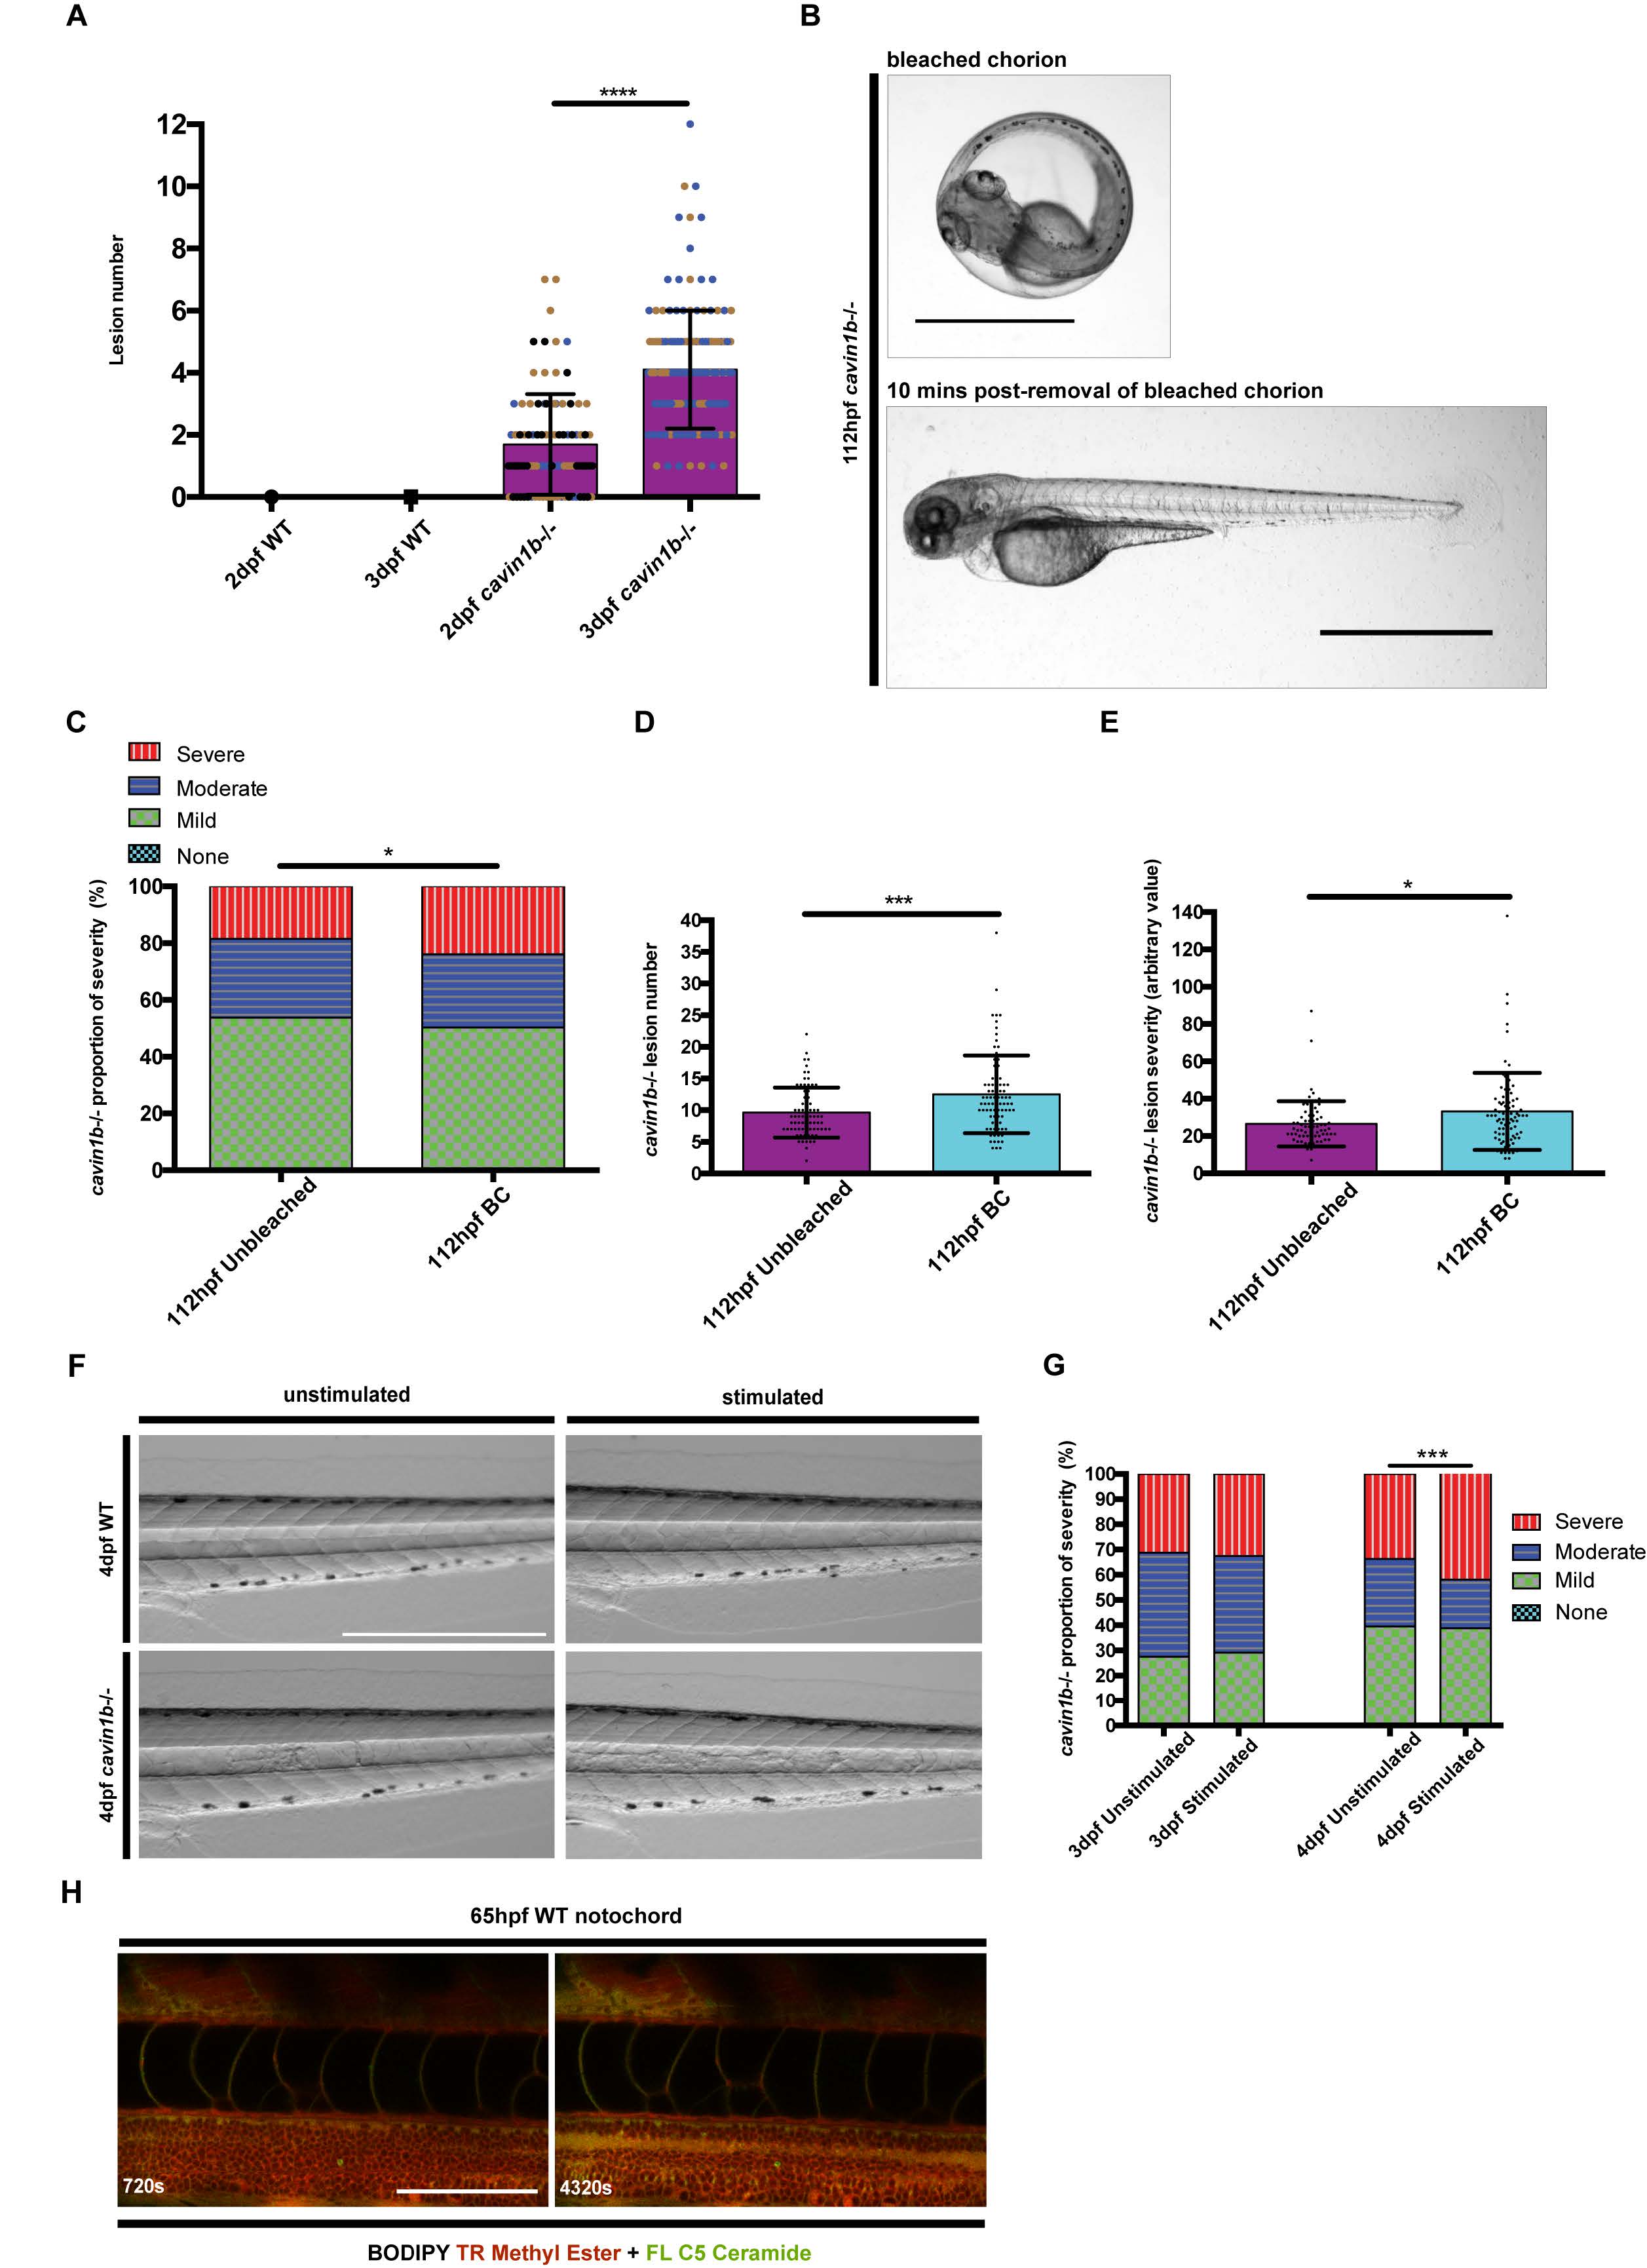
Lesion number in cavin1b-/- zebrafish, chorion bleaching experiment and proportion of severity in electrically stimulated (10 min) cavin1b-/- zebrafish, and prolonged electrical stimulation (76 min) on WT zebrafish, related to Figure 2, 6 and 7:
(A) Lesion number in 2 and 3 dpf WT and cavin1b-/- embryos. P value was calculated using a two-tailed, unpaired t-test. 3 clutches per group. Number of individuals used for 2 dpf and 3 dpf WT, and 2 dpf and 3 dpf cavin1b-/-=62, 72, 93, 144 respectively. Dot colors (blue, black, brown) represent different clutches.
(B) Representative images of a 112 hpf cavin1b-/- embryo in a bleached chorion (BC) and embryo condition 10 min post-removal of bleached chorion. Bar, 1 mm.
(C) Proportion of lesion severity in notochords of live cavin1b-/- embryos fixed in bleached chorion up to 5 dpf (BC) and unbleached cavin1b-/- embryos. There is no measurable lesion in WT controls (fish number=60, clutch number=3). P value was calculated using a chi square test.
(D-E) Charts showing comparisons in notochord lesion number and severity index score between cavin1b- /- embryos fixed in bleached chorion up to 5dpf (BC) and unbleached cavin1b-/- embryos. P values were calculated using a two-tailed, unpaired t-test.
For (C-E), 3 clutches per group, number of fish used for cavin1b-/- unbleached and BC= 73, 83 respectively.
(F) Images of unstimulated and electrically stimulated WT and cavin1b-/- embryos. Electrical stimulation (10 min) was performed at 3 dpf and embryos imaged at 4 dpf. Note the absence of measurable lesions (similar to those observed in corresponding cavin1b-/- images) before and after electrical stimulation in WT zebrafish. Note that skeletal muscle morphology is generally unaffected in both WT and cavin1b-/- embryos. Number of WT fish observed=83. Number of cavin1b-/- fish observed=71. 4 clutches per group. Bar, 0.5 mm.
(G) Chart showing the proportion of notochord lesion severity in 3 dpf embryos and corresponding 4 dpf cavin1b-/- embryos after electrical stimulation (10 min) at 3 dpf, and corresponding unstimulated controls. P values were calculated using a chi square test. 4 clutches per group. Number of fish used for both lines>80.
(H) Live confocal timelapse images of a 65 hpf WT notochord colabeled with BODIPY TR methyl ester and BODIPY FL C5-Ceramide under prolonged electrical stimulation (approximately 76 min). Frame rate=90 s, time stamp expressed in seconds. Bar, 100 μm.
For (A), (C-E), (G), * P≤ 0.05; *** P≤ 0.001; **** P≤ 0.0001. Data are presented as mean±SD.